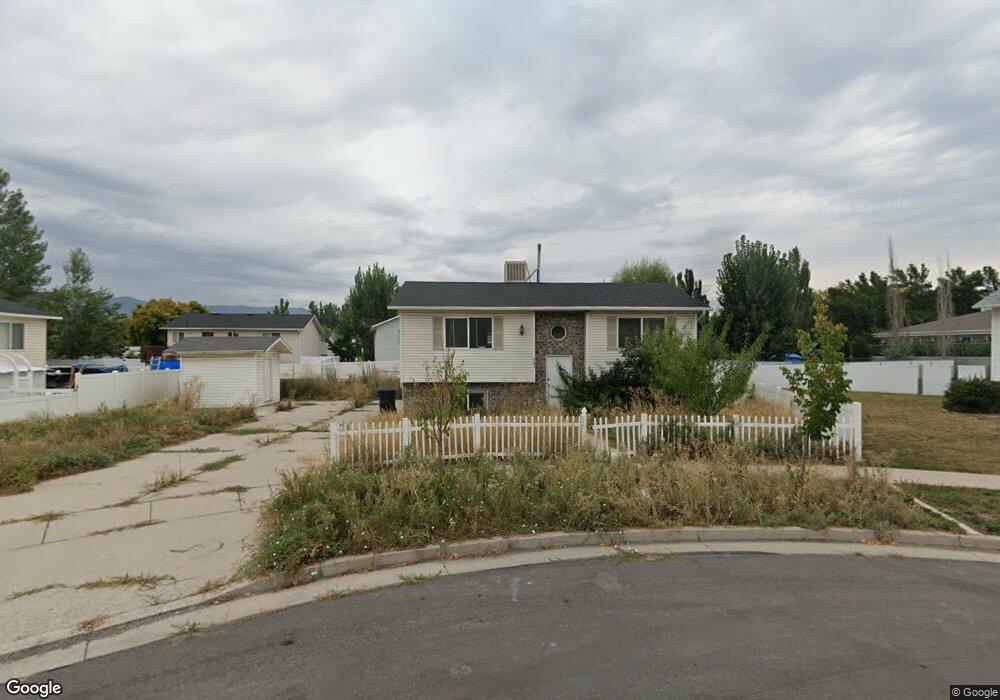
783 Linden Ct Logan, UT 84321
Woodruff NeighborhoodEstimated Value: $355,000 - $399,849
4
Beds
2
Baths
1,830
Sq Ft
$208/Sq Ft
Est. Value
About This Home
This home is located at 783 Linden Ct, Logan, UT 84321 and is currently estimated at $379,962, approximately $207 per square foot. 783 Linden Ct is a home located in Cache County with nearby schools including Hillcrest Elementary School, Mount Logan Middle School, and Logan High School.
Ownership History
Date
Name
Owned For
Owner Type
Purchase Details
Closed on
Mar 7, 2022
Sold by
Johnson Danny L
Bought by
Johnson Danny L and Johnson Tracy-Ann
Current Estimated Value
Home Financials for this Owner
Home Financials are based on the most recent Mortgage that was taken out on this home.
Original Mortgage
$219,600
Outstanding Balance
$203,877
Interest Rate
3.69%
Mortgage Type
New Conventional
Estimated Equity
$176,085
Purchase Details
Closed on
Aug 9, 2021
Sold by
Johnson Mark
Bought by
Johnson Danny L
Purchase Details
Closed on
Oct 6, 2016
Sold by
Benson Aaron D and Benson Veronica N
Bought by
Johnson Mark
Home Financials for this Owner
Home Financials are based on the most recent Mortgage that was taken out on this home.
Original Mortgage
$140,175
Interest Rate
3.44%
Mortgage Type
New Conventional
Purchase Details
Closed on
Aug 6, 2008
Sold by
Miller Gary A
Bought by
Benson Aaron D and Benson Veronica N
Home Financials for this Owner
Home Financials are based on the most recent Mortgage that was taken out on this home.
Original Mortgage
$131,118
Interest Rate
6.42%
Mortgage Type
FHA
Purchase Details
Closed on
Jul 27, 2006
Sold by
Miller Bruce E
Bought by
Miller Gary A
Home Financials for this Owner
Home Financials are based on the most recent Mortgage that was taken out on this home.
Original Mortgage
$7,200
Interest Rate
6.76%
Mortgage Type
Stand Alone Second
Purchase Details
Closed on
Jan 14, 2005
Sold by
Stubblefield Austin Lynn
Bought by
Miller Bruce E
Home Financials for this Owner
Home Financials are based on the most recent Mortgage that was taken out on this home.
Original Mortgage
$11,990
Interest Rate
5.67%
Mortgage Type
Credit Line Revolving
Purchase Details
Closed on
May 30, 2002
Sold by
Seamons Construction Inc
Bought by
Stubblefield Austin Lynn
Home Financials for this Owner
Home Financials are based on the most recent Mortgage that was taken out on this home.
Original Mortgage
$101,900
Interest Rate
6.89%
Mortgage Type
FHA
Create a Home Valuation Report for This Property
The Home Valuation Report is an in-depth analysis detailing your home's value as well as a comparison with similar homes in the area
Home Values in the Area
Average Home Value in this Area
Purchase History
| Date | Buyer | Sale Price | Title Company |
|---|---|---|---|
| Johnson Danny L | -- | None Listed On Document | |
| Johnson Danny L | -- | Inwest Title Svcs Inc Logan | |
| Johnson Mark | -- | Cache Title Company Inc | |
| Benson Aaron D | -- | Advanced Title | |
| Miller Gary A | -- | Pinnacle Title Ins Agency | |
| Miller Bruce E | -- | American Secure Title | |
| Stubblefield Austin Lynn | -- | American Secure Title |
Source: Public Records
Mortgage History
| Date | Status | Borrower | Loan Amount |
|---|---|---|---|
| Open | Johnson Danny L | $219,600 | |
| Previous Owner | Johnson Mark | $140,175 | |
| Previous Owner | Benson Aaron D | $131,118 | |
| Previous Owner | Miller Gary A | $7,200 | |
| Previous Owner | Miller Gary A | $127,081 | |
| Previous Owner | Miller Bruce E | $11,990 | |
| Previous Owner | Miller Bruce E | $95,920 | |
| Previous Owner | Stubblefield Austin Lynn | $101,900 | |
| Closed | Stubblefield Austin Lynn | $1,200 |
Source: Public Records
Tax History
| Year | Tax Paid | Tax Assessment Tax Assessment Total Assessment is a certain percentage of the fair market value that is determined by local assessors to be the total taxable value of land and additions on the property. | Land | Improvement |
|---|---|---|---|---|
| 2025 | $3,373 | $436,250 | $0 | $0 |
| 2024 | $3,508 | $439,375 | $0 | $0 |
| 2023 | $3,632 | $433,620 | $0 | $0 |
| 2022 | $3,369 | $375,620 | $0 | $0 |
| 2021 | $3,267 | $309,495 | $45,000 | $264,495 |
| 2020 | $2,234 | $190,475 | $45,000 | $145,475 |
| 2019 | $1,284 | $190,475 | $45,000 | $145,475 |
| 2018 | $1,266 | $171,500 | $45,000 | $126,500 |
| 2017 | $1,152 | $82,500 | $0 | $0 |
| 2016 | $1,195 | $82,500 | $0 | $0 |
| 2015 | $1,025 | $70,715 | $0 | $0 |
| 2014 | $927 | $70,715 | $0 | $0 |
| 2013 | -- | $70,715 | $0 | $0 |
Source: Public Records
Map
Nearby Homes
Your Personal Tour Guide
Ask me questions while you tour the home.