783 Main St Duryea, PA 18642
Estimated Value: $151,000 - $219,000
Studio
--
Bath
1,500
Sq Ft
$119/Sq Ft
Est. Value
About This Home
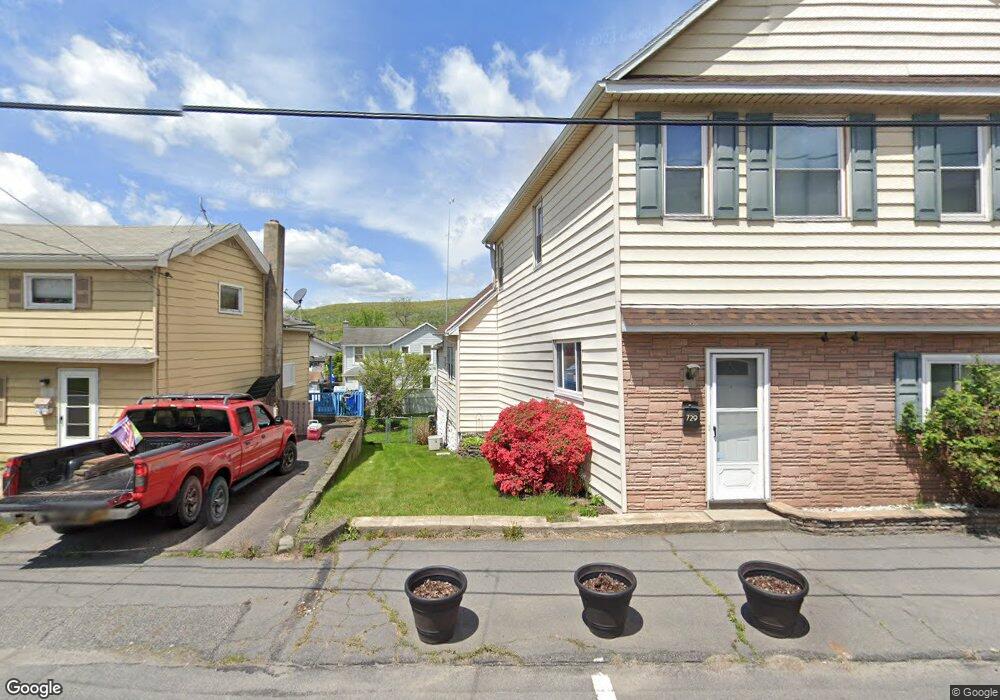
This home is located at 783 Main St, Duryea, PA 18642 and is currently estimated at $178,014, approximately $118 per square foot. 783 Main St is a home located in Luzerne County with nearby schools including Pittston City Intermediate Center, Pittston Area Middle School, and Pittston Area Senior High School.
Ownership History
Date
Name
Owned For
Owner Type
Purchase Details
Closed on
Mar 20, 2020
Sold by
Verdine Enterprises Llc
Bought by
Fernechick Marisa L
Current Estimated Value
Purchase Details
Closed on
Feb 27, 2017
Sold by
Champion Mortgage Co
Bought by
Verdine Enterprises Llc
Purchase Details
Closed on
Aug 29, 2016
Sold by
Clark John
Bought by
Champion Mortgage Company
Purchase Details
Closed on
Jan 1, 1960
Bought by
Clarke Albert and Clarke Mary
Create a Home Valuation Report for This Property
The Home Valuation Report is an in-depth analysis detailing your home's value as well as a comparison with similar homes in the area
Home Values in the Area
Average Home Value in this Area
Purchase History
| Date | Buyer | Sale Price | Title Company |
|---|---|---|---|
| Fernechick Marisa L | $111,800 | None Available | |
| Verdine Enterprises Llc | $22,000 | None Available | |
| Champion Mortgage Company | -- | None Available | |
| Clarke Albert | -- | -- |
Source: Public Records
Tax History
| Year | Tax Paid | Tax Assessment Tax Assessment Total Assessment is a certain percentage of the fair market value that is determined by local assessors to be the total taxable value of land and additions on the property. | Land | Improvement |
|---|---|---|---|---|
| 2026 | $1,917 | $74,600 | $21,800 | $52,800 |
| 2025 | $1,909 | $74,600 | $21,800 | $52,800 |
| 2024 | $1,909 | $74,600 | $21,800 | $52,800 |
| 2023 | $1,872 | $74,600 | $21,800 | $52,800 |
| 2022 | $1,836 | $74,600 | $21,800 | $52,800 |
| 2021 | $1,836 | $74,600 | $21,800 | $52,800 |
| 2020 | $1,794 | $74,600 | $21,800 | $52,800 |
| 2019 | $1,757 | $74,600 | $21,800 | $52,800 |
| 2018 | $1,720 | $74,600 | $21,800 | $52,800 |
| 2017 | $1,682 | $74,600 | $21,800 | $52,800 |
| 2016 | -- | $74,600 | $21,800 | $52,800 |
| 2015 | $1,293 | $74,600 | $21,800 | $52,800 |
| 2014 | $1,293 | $74,600 | $21,800 | $52,800 |
Source: Public Records
Map
Nearby Homes
- 398 N River St
- 120 Parkcrest Dr
- 742 Donnelly St
- 616 Rear Donnelly St
- 205 Stephenson St
- 616 Donnelly St
- 424 New St
- 114 Chittenden St
- 116 Broadhead St
- 116 Wright St
- 125 Mcalpine St
- 324 Milwaukee Ave
- 107 Stonecrest Dr
- Lot 32 Cremard Blvd
- 113 Taroli St
- 115 Taroli St Unit L20 22
- 15 Huckleberry Ln
- 134 Taroli St
- 347 Orchard St
- 421 W Mary St
Your Personal Tour Guide
Ask me questions while you tour the home.