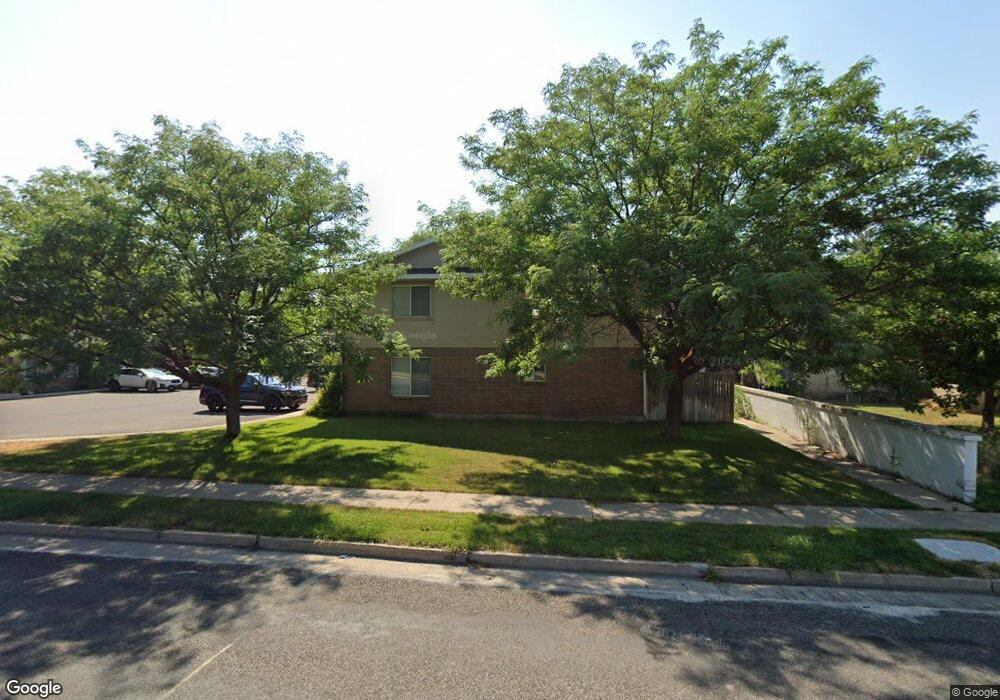
783 N 100 W Logan, UT 84321
Bridger NeighborhoodEstimated Value: $870,000 - $915,000
Studio
--
Bath
4,758
Sq Ft
$187/Sq Ft
Est. Value
About This Home
This home is located at 783 N 100 W, Logan, UT 84321 and is currently estimated at $888,333, approximately $186 per square foot. 783 N 100 W is a home with nearby schools including Bridger School, Mount Logan Middle School, and Logan High School.
Ownership History
Date
Name
Owned For
Owner Type
Purchase Details
Closed on
Jun 25, 2019
Sold by
Sre Brookwood Equity Llc
Bought by
Sr Eliason Apartment Rentals Llc
Current Estimated Value
Purchase Details
Closed on
Apr 19, 2014
Sold by
Eliason Stephen R and Eliason Marilyn D
Bought by
Sre 3E4n Equity Llc
Purchase Details
Closed on
Sep 19, 2006
Sold by
Eliason Stephen R and Eliason Marilyn D
Bought by
Eliason Stephen R and Eliason Marilyn D
Create a Home Valuation Report for This Property
The Home Valuation Report is an in-depth analysis detailing your home's value as well as a comparison with similar homes in the area
Home Values in the Area
Average Home Value in this Area
Purchase History
| Date | Buyer | Sale Price | Title Company |
|---|---|---|---|
| Sr Eliason Apartment Rentals Llc | -- | None Available | |
| Sre 3E4n Equity Llc | -- | None Available | |
| Eliason Stephen R | -- | Pinnacle Title Insurance Age |
Source: Public Records
Tax History
| Year | Tax Paid | Tax Assessment Tax Assessment Total Assessment is a certain percentage of the fair market value that is determined by local assessors to be the total taxable value of land and additions on the property. | Land | Improvement |
|---|---|---|---|---|
| 2025 | $3,322 | $781,070 | $219,300 | $561,770 |
| 2024 | $3,429 | $781,070 | $219,300 | $561,770 |
| 2023 | $3,578 | $776,770 | $215,000 | $561,770 |
| 2022 | $3,424 | $694,170 | $132,400 | $561,770 |
| 2021 | $3,733 | $643,100 | $132,400 | $510,700 |
| 2020 | $2,915 | $451,900 | $90,000 | $361,900 |
| 2019 | $3,047 | $451,900 | $90,000 | $361,900 |
| 2018 | $2,524 | $341,810 | $70,000 | $271,810 |
| 2017 | $2,397 | $171,655 | $0 | $0 |
| 2016 | $2,486 | $171,655 | $0 | $0 |
| 2015 | $2,488 | $171,655 | $0 | $0 |
| 2014 | $2,249 | $171,655 | $0 | $0 |
| 2013 | -- | $137,135 | $0 | $0 |
Source: Public Records
Map
Nearby Homes