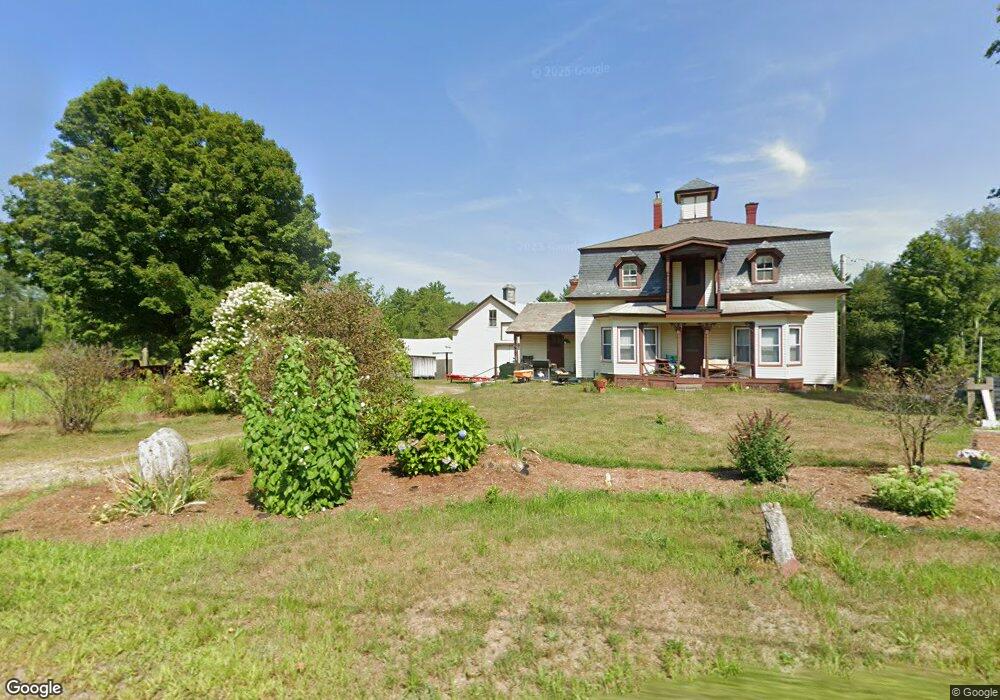
783 N Main St Orange, MA 01364
Estimated Value: $390,016 - $501,000
4
Beds
1
Bath
2,036
Sq Ft
$215/Sq Ft
Est. Value
About This Home
This home is located at 783 N Main St, Orange, MA 01364 and is currently estimated at $438,339, approximately $215 per square foot. 783 N Main St is a home located in Franklin County with nearby schools including Fisher Hill and Ralph C Mahar Regional School.
Ownership History
Date
Name
Owned For
Owner Type
Purchase Details
Closed on
Jun 19, 2025
Sold by
Lablanc Sally
Bought by
Sally Lebalc Ret and Leblanc
Current Estimated Value
Purchase Details
Closed on
Oct 2, 2014
Sold by
Barbara B Dickinson Ir B and Barbara Leblanc
Bought by
Leblanc Sally
Purchase Details
Closed on
Jul 24, 2007
Sold by
Dickinson Barbara B
Bought by
Barbara B Dickinson Ir B and Barbara Leblanc
Create a Home Valuation Report for This Property
The Home Valuation Report is an in-depth analysis detailing your home's value as well as a comparison with similar homes in the area
Home Values in the Area
Average Home Value in this Area
Purchase History
We collect this data history from publicly available records. To have your information removed, we recommend requesting removal directly through your county’s website.
| Date | Buyer | Sale Price | Title Company |
|---|---|---|---|
| Sally Lebalc Ret | -- | -- | |
| Leblanc Sally | -- | -- | |
| Leblanc Sally | -- | -- | |
| Leblanc Sally | -- | -- | |
| Leblanc Sally | -- | -- | |
| Barbara B Dickinson Ir B | -- | -- | |
| Barbara B Dickinson Ir B | -- | -- | |
| Ir Barbara B Dickinson | -- | -- | |
| Barbara B Dickinson Ir B | -- | -- |
Source: Public Records
Tax History
| Year | Tax Paid | Tax Assessment Tax Assessment Total Assessment is a certain percentage of the fair market value that is determined by local assessors to be the total taxable value of land and additions on the property. | Land | Improvement |
|---|---|---|---|---|
| 2025 | $5,564 | $338,235 | $55,935 | $282,300 |
| 2024 | $5,210 | $298,756 | $58,256 | $240,500 |
| 2023 | $4,825 | $268,656 | $58,256 | $210,400 |
| 2022 | $4,206 | $219,956 | $58,256 | $161,700 |
| 2021 | $3,975 | $198,256 | $74,856 | $123,400 |
| 2020 | $3,892 | $191,456 | $74,456 | $117,000 |
| 2019 | $3,878 | $172,214 | $67,814 | $104,400 |
| 2018 | $4,585 | $208,958 | $114,658 | $94,300 |
| 2017 | $4,436 | $208,958 | $114,658 | $94,300 |
| 2016 | $3,094 | $142,573 | $56,473 | $86,100 |
| 2015 | $2,949 | $141,990 | $55,890 | $86,100 |
| 2014 | $5,251 | $266,032 | $170,332 | $95,700 |
Source: Public Records
Map
Nearby Homes
- 855 N Main St
- 851 N Main St
- 844 N Main St
- 859 N Main St
- 856 N Main St
- 863 N Main St
- 860 N Main St
- 862 N Main St
- 720 N Main St
- 21 Look n Good Farm Dr S
- 1 Nice Place
- 864 N Main St
- 20 Look n Good Farm Dr N
- 273 Wheeler Ave
- 24 Temple Rd
- 261 Wheeler Ave
- 955 Oxbow Rd
- 875 N Main St
- 265 Wheeler Ave
- 260 Wheeler Ave
Your Personal Tour Guide
Ask me questions while you tour the home.