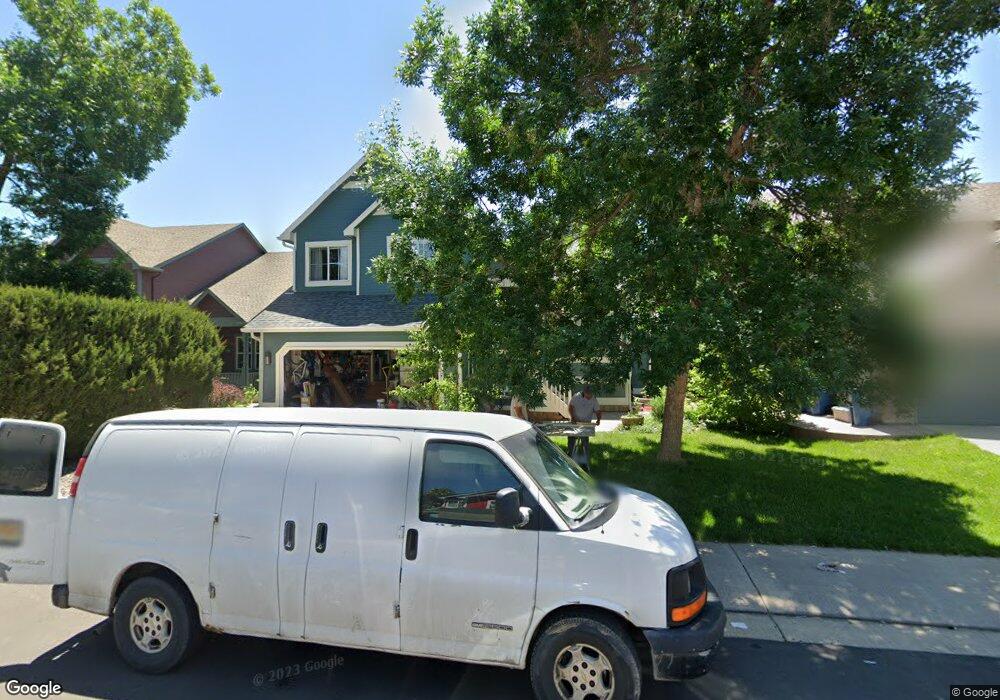
783 Nighthawk Cir Louisville, CO 80027
Estimated Value: $904,817 - $1,172,000
4
Beds
4
Baths
2,434
Sq Ft
$419/Sq Ft
Est. Value
About This Home
This home is located at 783 Nighthawk Cir, Louisville, CO 80027 and is currently estimated at $1,020,954, approximately $419 per square foot. 783 Nighthawk Cir is a home located in Boulder County with nearby schools including Fireside Elementary School, Monarch K-8 School, and Monarch High School.
Ownership History
Date
Name
Owned For
Owner Type
Purchase Details
Closed on
May 31, 2007
Sold by
Bivrell Paul F and Bivrell Suzanne M
Bought by
Boulding Carew E and Grider Aaron
Current Estimated Value
Home Financials for this Owner
Home Financials are based on the most recent Mortgage that was taken out on this home.
Original Mortgage
$268,000
Outstanding Balance
$163,810
Interest Rate
6.17%
Mortgage Type
Purchase Money Mortgage
Estimated Equity
$857,144
Purchase Details
Closed on
Oct 11, 2001
Sold by
Winquist Heidi E and Shapiro Robert S
Bought by
Bivrell Paul F
Home Financials for this Owner
Home Financials are based on the most recent Mortgage that was taken out on this home.
Original Mortgage
$275,000
Interest Rate
6.85%
Purchase Details
Closed on
Apr 4, 1996
Sold by
Mcstain Enterprises Inc
Bought by
Winquist Heidi E
Home Financials for this Owner
Home Financials are based on the most recent Mortgage that was taken out on this home.
Original Mortgage
$202,878
Interest Rate
7.35%
Mortgage Type
VA
Create a Home Valuation Report for This Property
The Home Valuation Report is an in-depth analysis detailing your home's value as well as a comparison with similar homes in the area
Home Values in the Area
Average Home Value in this Area
Purchase History
| Date | Buyer | Sale Price | Title Company |
|---|---|---|---|
| Boulding Carew E | $380,000 | Landamerica | |
| Bivrell Paul F | $349,900 | Land Title | |
| Winquist Heidi E | $202,856 | -- |
Source: Public Records
Mortgage History
| Date | Status | Borrower | Loan Amount |
|---|---|---|---|
| Open | Boulding Carew E | $268,000 | |
| Previous Owner | Bivrell Paul F | $275,000 | |
| Previous Owner | Winquist Heidi E | $202,878 |
Source: Public Records
Tax History Compared to Growth
Tax History
| Year | Tax Paid | Tax Assessment Tax Assessment Total Assessment is a certain percentage of the fair market value that is determined by local assessors to be the total taxable value of land and additions on the property. | Land | Improvement |
|---|---|---|---|---|
| 2025 | $5,660 | $63,944 | $21,131 | $42,813 |
| 2024 | $5,660 | $63,944 | $21,131 | $42,813 |
| 2023 | $5,564 | $62,973 | $22,914 | $43,744 |
| 2022 | $4,796 | $49,831 | $17,736 | $32,095 |
| 2021 | $4,895 | $52,853 | $18,812 | $34,041 |
| 2020 | $4,227 | $45,167 | $15,802 | $29,365 |
| 2019 | $4,167 | $45,167 | $15,802 | $29,365 |
| 2018 | $3,859 | $43,200 | $7,920 | $35,280 |
| 2017 | $3,783 | $52,082 | $8,756 | $43,326 |
| 2016 | $3,715 | $42,228 | $11,940 | $30,288 |
| 2015 | $3,521 | $36,194 | $15,920 | $20,274 |
| 2014 | $3,031 | $35,446 | $19,343 | $16,103 |
Source: Public Records
Map
Nearby Homes
- 494 Owl Dr Unit 4
- 810 Trail Ridge Dr
- 408 Fillmore Ct
- 593 Wildrose Way
- 823 Trail Ridge Dr
- 118 S Tanager Ct
- 592 Spruce Cir
- 848 Trail Ridge Dr
- 812 W Mulberry St
- 159 S Polk Ave
- 900 Eldorado Ln
- 426 W Spruce Ln
- 641 W Dahlia St
- 955 Arapahoe Cir
- 1006 Honeysuckle Ln
- 958 Eldorado Ln
- 935 Eldorado Ln
- 935 Eldorado Ln Unit A
- 279 S Taft Ct Unit 53
- 291 W Sycamore Ln
- 787 Nighthawk Cir
- 779 Nighthawk Cir
- 733 Nighthawk Cir
- 731 Nighthawk Cir
- 789 Nighthawk Cir
- 737 Nighthawk Cir
- 767 Nighthawk Cir
- 727 Nighthawk Cir
- 784 Nighthawk Cir
- 788 Nighthawk Cir
- 780 Nighthawk Cir
- 791 Nighthawk Cir
- 755 Nighthawk Cir
- 723 Nighthawk Cir
- 739 Nighthawk Cir
- 790 Nighthawk Cir
- 776 Nighthawk Cir
- 793 Nighthawk Cir
- 792 Nighthawk Cir
- 717 Nighthawk Cir