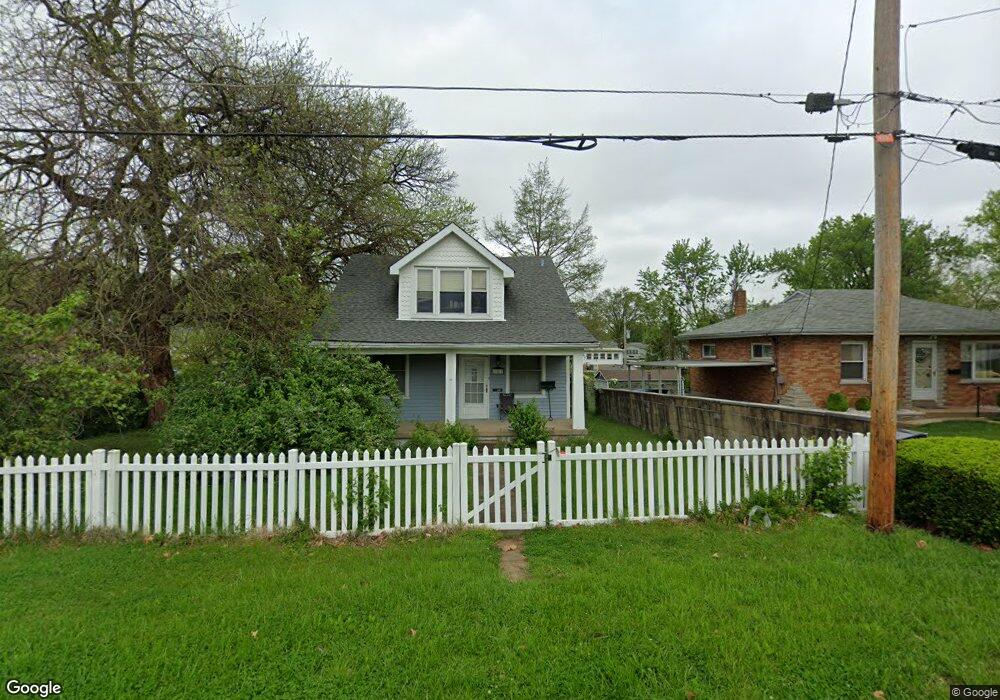
783 Pardella Ave Saint Louis, MO 63125
Lemay NeighborhoodEstimated Value: $167,250 - $246,000
3
Beds
3
Baths
1,411
Sq Ft
$141/Sq Ft
Est. Value
About This Home
This home is located at 783 Pardella Ave, Saint Louis, MO 63125 and is currently estimated at $198,813, approximately $140 per square foot. 783 Pardella Ave is a home located in St. Louis County with nearby schools including Hancock Place Elementary School, Hancock Place Middle School, and Hancock Place High School.
Ownership History
Date
Name
Owned For
Owner Type
Purchase Details
Closed on
Jan 29, 2016
Sold by
Lay John and Summers Amy S
Bought by
Urbanowicz John
Current Estimated Value
Home Financials for this Owner
Home Financials are based on the most recent Mortgage that was taken out on this home.
Original Mortgage
$117,000
Outstanding Balance
$93,205
Interest Rate
4.01%
Mortgage Type
New Conventional
Estimated Equity
$105,608
Purchase Details
Closed on
May 28, 2004
Sold by
Williams Connie
Bought by
Hartmann Clara and Mantych Ronald S
Purchase Details
Closed on
Jul 23, 2001
Sold by
Fox Matthew E
Bought by
Summers Amy S
Home Financials for this Owner
Home Financials are based on the most recent Mortgage that was taken out on this home.
Original Mortgage
$81,717
Interest Rate
7.07%
Mortgage Type
FHA
Create a Home Valuation Report for This Property
The Home Valuation Report is an in-depth analysis detailing your home's value as well as a comparison with similar homes in the area
Home Values in the Area
Average Home Value in this Area
Purchase History
| Date | Buyer | Sale Price | Title Company |
|---|---|---|---|
| Urbanowicz John | -- | Orntic St Louis | |
| Hartmann Clara | -- | -- | |
| Summers Amy S | $83,000 | -- |
Source: Public Records
Mortgage History
| Date | Status | Borrower | Loan Amount |
|---|---|---|---|
| Open | Urbanowicz John | $117,000 | |
| Previous Owner | Summers Amy S | $81,717 |
Source: Public Records
Tax History
| Year | Tax Paid | Tax Assessment Tax Assessment Total Assessment is a certain percentage of the fair market value that is determined by local assessors to be the total taxable value of land and additions on the property. | Land | Improvement |
|---|---|---|---|---|
| 2025 | $2,223 | $32,760 | $8,060 | $24,700 |
| 2024 | $2,223 | $28,690 | $5,380 | $23,310 |
| 2023 | $2,111 | $28,690 | $5,380 | $23,310 |
| 2022 | $1,882 | $23,150 | $4,660 | $18,490 |
| 2021 | $1,849 | $23,150 | $4,660 | $18,490 |
| 2020 | $1,641 | $19,590 | $5,240 | $14,350 |
| 2019 | $1,637 | $19,590 | $5,240 | $14,350 |
| 2018 | $1,289 | $13,400 | $4,050 | $9,350 |
| 2016 | $1,377 | $14,060 | $2,850 | $11,210 |
Source: Public Records
Map
Nearby Homes
- 816 Regina Ave
- 705 Lagro Ave
- 707 Pardella Ave
- 715 Erskine Ave
- 711 Erskine Ave
- 939 Erskine Ave
- 612 Horn Ave
- 704 Dallas Dr
- 619 Waller Ave
- 717 Bartolet Ave
- 334 Horn Ave
- 1036 Wachtel Ave
- 423 Degenhardt Ave
- 229 Horn Ave
- 331 Rauhut Ave
- 9533 Gentry Ave
- 251 Wachtel Ave
- 252 Wachtel Ave
- 210 Horn Ave
- 213 Waller Ave
- 781 Pardella Ave
- 3707 Hoffmeister Ave
- 777 Pardella Ave
- 775 Pardella Ave
- 3704 Hoffmeister Ave
- 3700 Hoffmeister Ave
- 3706 Hoffmeister Ave
- 3710 Hoffmeister Ave
- 771 Pardella Ave
- 784 Pardella Ave
- 3714 Hoffmeister Ave
- 788 Pardella Ave
- 780 Pardella Ave
- 3628 Hoffmeister Ave
- 780 Reed Ave
- 3628 S Hoffmeister 3630 Ave
- 36283630 S Hoffmeister Ave
- 778 Reed Ave
- 778 Pardella Ave
- 776 Reed Ave
Your Personal Tour Guide
Ask me questions while you tour the home.