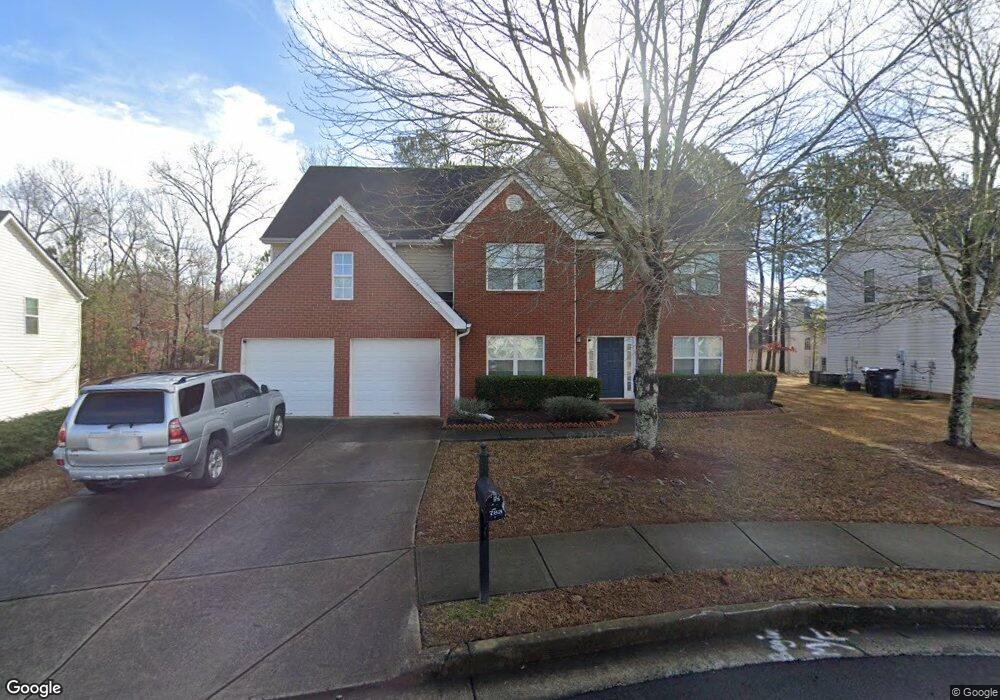
783 Roxholly Walk Unit 2 Buford, GA 30518
Estimated Value: $473,000 - $505,000
4
Beds
3
Baths
2,904
Sq Ft
$168/Sq Ft
Est. Value
About This Home
This home is located at 783 Roxholly Walk Unit 2, Buford, GA 30518 and is currently estimated at $488,959, approximately $168 per square foot. 783 Roxholly Walk Unit 2 is a home located in Gwinnett County with nearby schools including Sugar Hill Elementary School, Lanier Middle School, and Lanier High School.
Ownership History
Date
Name
Owned For
Owner Type
Purchase Details
Closed on
Jan 21, 2021
Sold by
Kim Elizabeth
Bought by
Huang Lei and Lao Jizhen
Current Estimated Value
Home Financials for this Owner
Home Financials are based on the most recent Mortgage that was taken out on this home.
Original Mortgage
$201,500
Outstanding Balance
$145,960
Interest Rate
2.6%
Mortgage Type
New Conventional
Estimated Equity
$342,999
Purchase Details
Closed on
Dec 10, 2015
Sold by
Kim Byeung G
Bought by
Kim Elizabeth
Home Financials for this Owner
Home Financials are based on the most recent Mortgage that was taken out on this home.
Original Mortgage
$186,813
Interest Rate
3.62%
Mortgage Type
FHA
Purchase Details
Closed on
Mar 3, 2014
Sold by
Kim Byeung Gi
Bought by
Kim Byeung G and Kim Elizabeth
Purchase Details
Closed on
Jun 23, 2004
Sold by
D G Jenkins Dev Corp
Bought by
Kim Byeung G
Home Financials for this Owner
Home Financials are based on the most recent Mortgage that was taken out on this home.
Original Mortgage
$163,500
Interest Rate
6.25%
Mortgage Type
New Conventional
Create a Home Valuation Report for This Property
The Home Valuation Report is an in-depth analysis detailing your home's value as well as a comparison with similar homes in the area
Home Values in the Area
Average Home Value in this Area
Purchase History
| Date | Buyer | Sale Price | Title Company |
|---|---|---|---|
| Huang Lei | $325,000 | -- | |
| Kim Elizabeth | -- | -- | |
| Kim Byeung G | -- | -- | |
| Kim Byeung G | $204,400 | -- |
Source: Public Records
Mortgage History
| Date | Status | Borrower | Loan Amount |
|---|---|---|---|
| Open | Huang Lei | $201,500 | |
| Previous Owner | Kim Elizabeth | $186,813 | |
| Previous Owner | Kim Byeung G | $163,500 |
Source: Public Records
Tax History Compared to Growth
Tax History
| Year | Tax Paid | Tax Assessment Tax Assessment Total Assessment is a certain percentage of the fair market value that is determined by local assessors to be the total taxable value of land and additions on the property. | Land | Improvement |
|---|---|---|---|---|
| 2025 | $7,364 | $199,720 | $50,000 | $149,720 |
| 2024 | $6,406 | $170,360 | $35,200 | $135,160 |
| 2023 | $6,406 | $170,360 | $35,200 | $135,160 |
| 2022 | $4,944 | $130,000 | $28,000 | $102,000 |
| 2021 | $3,874 | $117,920 | $24,000 | $93,920 |
| 2020 | $3,636 | $105,640 | $20,000 | $85,640 |
| 2019 | $3,525 | $105,640 | $20,000 | $85,640 |
| 2018 | $3,444 | $101,720 | $20,000 | $81,720 |
| 2016 | $3,254 | $92,000 | $17,360 | $74,640 |
| 2015 | $2,837 | $76,760 | $12,000 | $64,760 |
| 2014 | $2,852 | $76,760 | $12,000 | $64,760 |
Source: Public Records
Map
Nearby Homes
- 812 Holly Meadow Dr
- 682 Montglade Ct Unit 1
- 665 Roxford Ln Unit 3
- 3811 Roxfield Dr
- 3725 Roxwood Park Dr Unit 1
- 3805 Roxwood Park Dr Unit 1
- 3740 Crescent Walk Ln
- 3720 Crescent Walk Ln
- 3612 Brookefall Ct
- 3645 Hickory Branch Trail Unit 1
- 3941 Oak Crossing Dr
- 3929 Two Bridge Dr
- 955 Laura Jean Ct
- 3998 Oak Crossing Dr NE
- 3720 Brookefall Landing
- 3540 Hickory Branch Trail
- 189 Rutlidge Park Ln
- 515 Morning Creek Ln
- 407 Vista Lake Dr
- 783 Roxholly Walk NE
- 773 Roxholly Walk
- 793 Roxholly Walk Unit 2
- 955 Sentry Ridge Crossing Unit 4
- 763 Roxholly Walk
- 945 Sentry Ridge Crossing
- 965 Sentry Ridge Crossing Unit 4
- 931 Holly Meadow Dr
- 794 Roxholly Walk
- 753 Roxholly Walk NE
- 753 Roxholly Walk
- 764 Roxholly Walk Unit 3
- 935 Sentry Ridge Crossing
- 0 Holly Meadow Dr Unit 7336816
- 0 Holly Meadow Dr Unit 3241472
- 0 Holly Meadow Dr Unit 7597640
- 0 Holly Meadow Dr Unit 7550162
- 0 Holly Meadow Dr
- 975 Sentry Ridge Crossing
- 912 Holly Meadow Dr