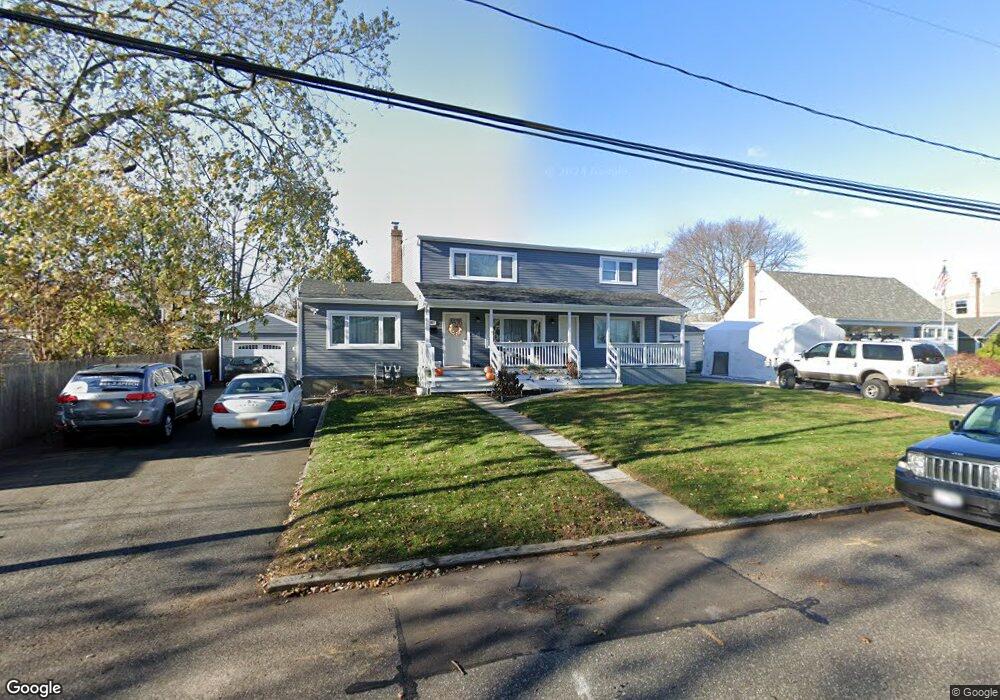
783 S Walnut St Lindenhurst, NY 11757
Estimated Value: $663,324 - $740,000
--
Bed
--
Bath
2,064
Sq Ft
$345/Sq Ft
Est. Value
About This Home
This home is located at 783 S Walnut St, Lindenhurst, NY 11757 and is currently estimated at $711,581, approximately $344 per square foot. 783 S Walnut St is a home located in Suffolk County with nearby schools including Lindenhurst Middle School and Lindenhurst Senior High School.
Ownership History
Date
Name
Owned For
Owner Type
Purchase Details
Closed on
Jun 26, 2017
Sold by
Referee Of Suffolk County
Bought by
Moran Brian
Current Estimated Value
Purchase Details
Closed on
Feb 10, 2016
Sold by
Bank Of America N A
Bought by
Wells Fargo Bank N A
Purchase Details
Closed on
Jun 15, 2004
Sold by
Alongi Joseph and Alongi Tina
Bought by
Puka Francesk and Puka Ermira
Home Financials for this Owner
Home Financials are based on the most recent Mortgage that was taken out on this home.
Original Mortgage
$300,000
Interest Rate
6.32%
Mortgage Type
Stand Alone First
Purchase Details
Closed on
Nov 21, 2002
Sold by
Alongi Joseph
Bought by
Alongi Joseph and Alongi Tina
Home Financials for this Owner
Home Financials are based on the most recent Mortgage that was taken out on this home.
Original Mortgage
$155,000
Interest Rate
5.75%
Create a Home Valuation Report for This Property
The Home Valuation Report is an in-depth analysis detailing your home's value as well as a comparison with similar homes in the area
Home Values in the Area
Average Home Value in this Area
Purchase History
| Date | Buyer | Sale Price | Title Company |
|---|---|---|---|
| Moran Brian | $222,000 | None Available | |
| Moran Brian | $222,000 | None Available | |
| Wells Fargo Bank N A | -- | None Available | |
| Wells Fargo Bank N A | -- | None Available | |
| Puka Francesk | $425,000 | -- | |
| Puka Francesk | $425,000 | -- | |
| Alongi Joseph | -- | Stewart Title Insurance Co | |
| Alongi Joseph | -- | Stewart Title Insurance Co |
Source: Public Records
Mortgage History
| Date | Status | Borrower | Loan Amount |
|---|---|---|---|
| Previous Owner | Puka Francesk | $300,000 | |
| Previous Owner | Alongi Joseph | $155,000 |
Source: Public Records
Tax History Compared to Growth
Tax History
| Year | Tax Paid | Tax Assessment Tax Assessment Total Assessment is a certain percentage of the fair market value that is determined by local assessors to be the total taxable value of land and additions on the property. | Land | Improvement |
|---|---|---|---|---|
| 2024 | $16,459 | $4,120 | $280 | $3,840 |
| 2023 | $14,062 | $4,320 | $280 | $4,040 |
| 2022 | $13,396 | $4,320 | $280 | $4,040 |
| 2021 | $13,396 | $4,320 | $280 | $4,040 |
| 2020 | $13,531 | $4,320 | $280 | $4,040 |
| 2019 | $15,083 | $0 | $0 | $0 |
| 2018 | $13,354 | $4,320 | $280 | $4,040 |
| 2017 | $13,354 | $4,320 | $280 | $4,040 |
| 2016 | $13,366 | $4,320 | $280 | $4,040 |
| 2015 | -- | $4,320 | $280 | $4,040 |
| 2014 | -- | $4,320 | $280 | $4,040 |
Source: Public Records
Map
Nearby Homes
- 789 S Walnut St
- 777 S Walnut St
- 780 S Broadway
- 793 S Walnut St
- 790 S Broadway
- 768 S Broadway
- 771 S Walnut St
- 786 S Walnut St
- 794 S Broadway
- 768 S Walnut St
- 797 S Walnut St
- 756 S Broadway
- 764 S Walnut St
- 798 S Broadway
- 798 S Broadway Unit 1
- 798 S Broadway Unit 2
- 765 S Walnut St
- 762 S Walnut St
- 773 Pecan St
- 744 S Broadway