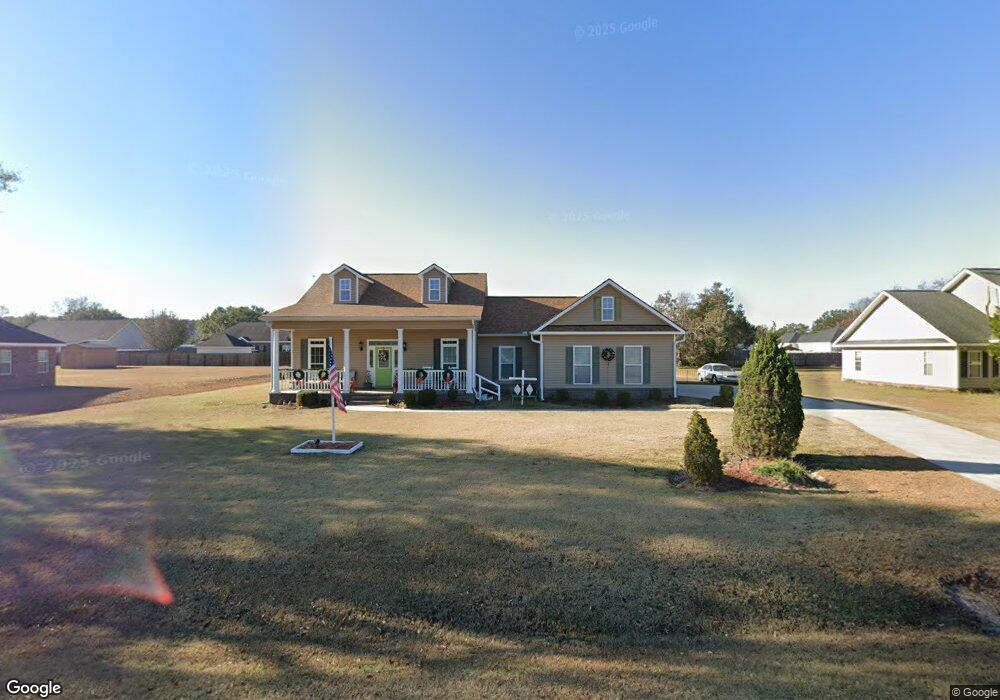
783 Spence Dr Brooklet, GA 30415
Estimated Value: $343,743 - $362,000
3
Beds
2
Baths
2,113
Sq Ft
$167/Sq Ft
Est. Value
About This Home
This home is located at 783 Spence Dr, Brooklet, GA 30415 and is currently estimated at $352,186, approximately $166 per square foot. 783 Spence Dr is a home located in Bulloch County with nearby schools including Brooklet Elementary School, Southeast Bulloch High School, and Southeast Bulloch Middle School.
Ownership History
Date
Name
Owned For
Owner Type
Purchase Details
Closed on
Jan 9, 2018
Sold by
Sorensen Charles C
Bought by
Sorensen Marilyn A
Current Estimated Value
Purchase Details
Closed on
Sep 1, 2006
Sold by
Not Provided
Bought by
Sorensen Charles C and Sorensen Marilyn A
Home Financials for this Owner
Home Financials are based on the most recent Mortgage that was taken out on this home.
Original Mortgage
$99,500
Interest Rate
6.58%
Mortgage Type
New Conventional
Purchase Details
Closed on
Jan 24, 2006
Sold by
Not Provided
Bought by
Sorensen Charles C and Sorensen Marilyn A
Purchase Details
Closed on
Aug 10, 2005
Bought by
Marlowe Richard L
Purchase Details
Closed on
Feb 20, 2004
Bought by
Scott Scott and Scott Scott
Create a Home Valuation Report for This Property
The Home Valuation Report is an in-depth analysis detailing your home's value as well as a comparison with similar homes in the area
Purchase History
| Date | Buyer | Sale Price | Title Company |
|---|---|---|---|
| Sorensen Marilyn A | -- | -- | |
| Sorensen Charles C | $179,500 | -- | |
| Sorensen Charles C | $64,000 | -- | |
| Marlowe Richard L | -- | -- | |
| Scott Scott | -- | -- |
Source: Public Records
Mortgage History
| Date | Status | Borrower | Loan Amount |
|---|---|---|---|
| Previous Owner | Sorensen Charles C | $99,500 |
Source: Public Records
Tax History
| Year | Tax Paid | Tax Assessment Tax Assessment Total Assessment is a certain percentage of the fair market value that is determined by local assessors to be the total taxable value of land and additions on the property. | Land | Improvement |
|---|---|---|---|---|
| 2025 | $3,692 | $136,592 | $18,000 | $118,592 |
| 2024 | $3,565 | $127,472 | $18,000 | $109,472 |
| 2023 | $3,369 | $109,640 | $14,000 | $95,640 |
| 2022 | $1,858 | $88,080 | $9,400 | $78,680 |
| 2021 | $1,626 | $75,467 | $9,400 | $66,067 |
| 2020 | $1,601 | $72,460 | $9,400 | $63,060 |
| 2019 | $1,584 | $71,330 | $8,800 | $62,530 |
| 2018 | $1,536 | $70,132 | $8,800 | $61,332 |
| 2017 | $1,498 | $67,599 | $8,800 | $58,799 |
| 2016 | $1,492 | $65,646 | $8,800 | $56,846 |
| 2015 | $1,478 | $64,760 | $8,800 | $55,960 |
| 2014 | $1,362 | $64,760 | $8,800 | $55,960 |
Source: Public Records
Map
Nearby Homes
- 1615 Colony Ln
- 0 Old Leefield Rd Unit 10626397
- 116 Summer Wind Place
- 10143 U S 80
- 19477 Us Highway 80 E
- 713 W Lane St
- 209 Elm St
- 207 Dixie St
- 210 Parker Ave N
- 0 E Highway 80 Hwy Unit 10490324
- 893 W Lane St
- 206 E Lane St
- 643 Buie Rd
- 305 Treasure Blvd
- 1603 Lennox Rd
- 111 Old Auburn Ln
- 10544 Burkhalter Rd
- 20596 US Highway 80 E
- 6302 C T Place
- 3106 Mccall Blvd
- 781 Spence Dr
- 785 Spence Dr
- 1517 Tara Blvd
- 1515 Tara Blvd
- 1519 Tara Blvd
- 779 Spence Dr
- 787 Spence Dr
- 1513 Tara Blvd
- 1521 Tara Blvd Unit 45
- 1521 Tara Blvd
- LOT 38 Tara Blvd
- 789 Spence Dr
- 777 Spence Dr
- 1511 Tara Blvd
- 1800 Rhett Ct
- 1523 Tara Blvd
- 1701 Scarlett Place
- 1801 Rhett Ct
- LOT 38 Rhett
- 791 Spence Dr
Your Personal Tour Guide
Ask me questions while you tour the home.