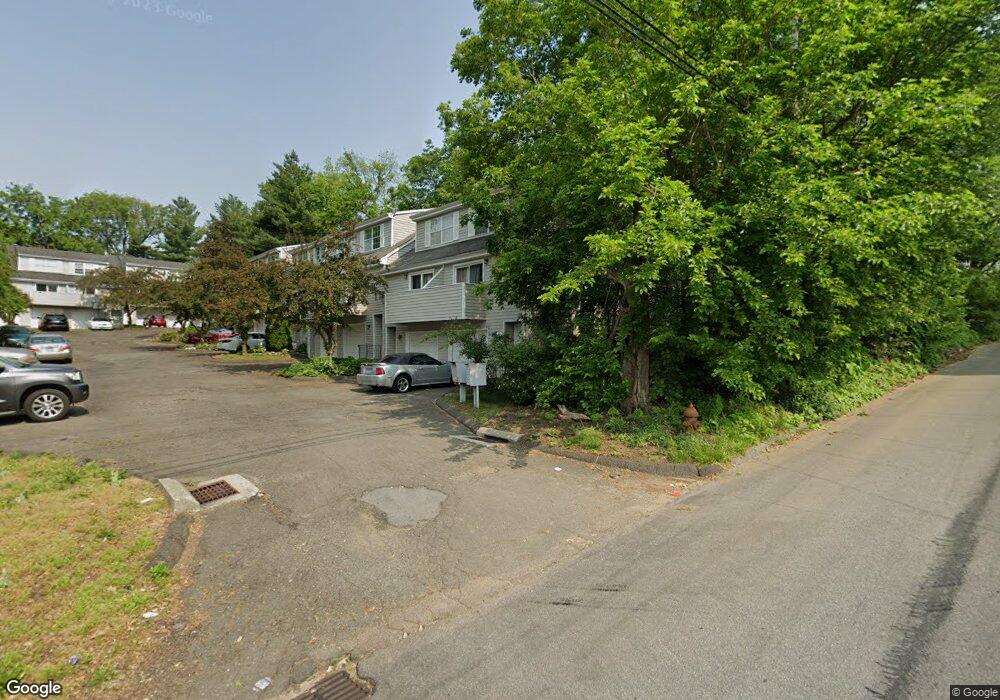
783 Sylvan Ave Unit 5 Bridgeport, CT 06606
Reservoir-Whiskey Hill NeighborhoodEstimated Value: $228,000 - $288,000
2
Beds
2
Baths
1,149
Sq Ft
$234/Sq Ft
Est. Value
About This Home
This home is located at 783 Sylvan Ave Unit 5, Bridgeport, CT 06606 and is currently estimated at $268,327, approximately $233 per square foot. 783 Sylvan Ave Unit 5 is a home located in Fairfield County with nearby schools including Hallen School, Central High School, and Northeastern Adventist Academy - Fairfield County.
Ownership History
Date
Name
Owned For
Owner Type
Purchase Details
Closed on
Sep 10, 1996
Sold by
Pajolek Thomas R
Bought by
Monge Myrna and Monge Luis
Current Estimated Value
Home Financials for this Owner
Home Financials are based on the most recent Mortgage that was taken out on this home.
Original Mortgage
$51,300
Interest Rate
8.11%
Mortgage Type
Unknown
Create a Home Valuation Report for This Property
The Home Valuation Report is an in-depth analysis detailing your home's value as well as a comparison with similar homes in the area
Home Values in the Area
Average Home Value in this Area
Purchase History
| Date | Buyer | Sale Price | Title Company |
|---|---|---|---|
| Monge Myrna | $54,000 | -- | |
| Monge Myrna | $54,000 | -- |
Source: Public Records
Mortgage History
| Date | Status | Borrower | Loan Amount |
|---|---|---|---|
| Open | Monge Myrna | $124,000 | |
| Closed | Monge Myrna | $50,000 | |
| Closed | Monge Myrna | $51,300 |
Source: Public Records
Tax History Compared to Growth
Tax History
| Year | Tax Paid | Tax Assessment Tax Assessment Total Assessment is a certain percentage of the fair market value that is determined by local assessors to be the total taxable value of land and additions on the property. | Land | Improvement |
|---|---|---|---|---|
| 2025 | $3,370 | $77,550 | $0 | $77,550 |
| 2024 | $3,370 | $77,550 | $0 | $77,550 |
| 2023 | $3,370 | $77,550 | $0 | $77,550 |
| 2022 | $3,370 | $77,550 | $0 | $77,550 |
| 2021 | $3,370 | $77,550 | $0 | $77,550 |
| 2020 | $3,526 | $65,310 | $0 | $65,310 |
| 2019 | $3,526 | $65,310 | $0 | $65,310 |
| 2018 | $3,551 | $65,310 | $0 | $65,310 |
| 2017 | $3,551 | $65,310 | $0 | $65,310 |
| 2016 | $3,551 | $65,310 | $0 | $65,310 |
| 2015 | $4,598 | $108,950 | $0 | $108,950 |
| 2014 | $4,598 | $108,950 | $0 | $108,950 |
Source: Public Records
Map
Nearby Homes
- 769 Sylvan Ave Unit 16
- 769 Sylvan Ave Unit 13
- 28 Wilkins Ave
- 15 Edwards St
- 110 Wilkins Ave
- 130 Wilkins Ave
- 1053 Sylvan Ave
- 45 Polk St
- 717 Reservoir Ave
- 705 Reservoir Ave
- 1088 Sylvan Ave
- 36 Platt St
- 16 Oakdale St
- 438 Soundview Ave
- 217 Hillcrest Rd
- 385 Chamberlain Ave
- 355 Chamberlain Ave
- 250 Dayton Rd
- 49 Soundview Ave
- 285 Alba Ave
- 783 Sylvan Ave Unit 8
- 783 Sylvan Ave Unit 7
- 783 Sylvan Ave Unit 6
- 783 Sylvan Ave Unit 4
- 783 Sylvan Ave Unit 3
- 783 Sylvan Ave Unit 2
- 783 Sylvan Ave Unit 1
- 799 Sylvan Ave
- 782 Sylvan Ave
- 54 Funston Ave
- 800 Sylvan Ave
- 815 Sylvan Ave
- 810 Sylvan Ave
- 810 Sylvan Ave Unit 2
- 751 Sylvan Ave
- 690 Sylvan Ave
- 812 Sylvan Ave
- 51 Funston Ave Unit 53
- 680 Sylvan Ave