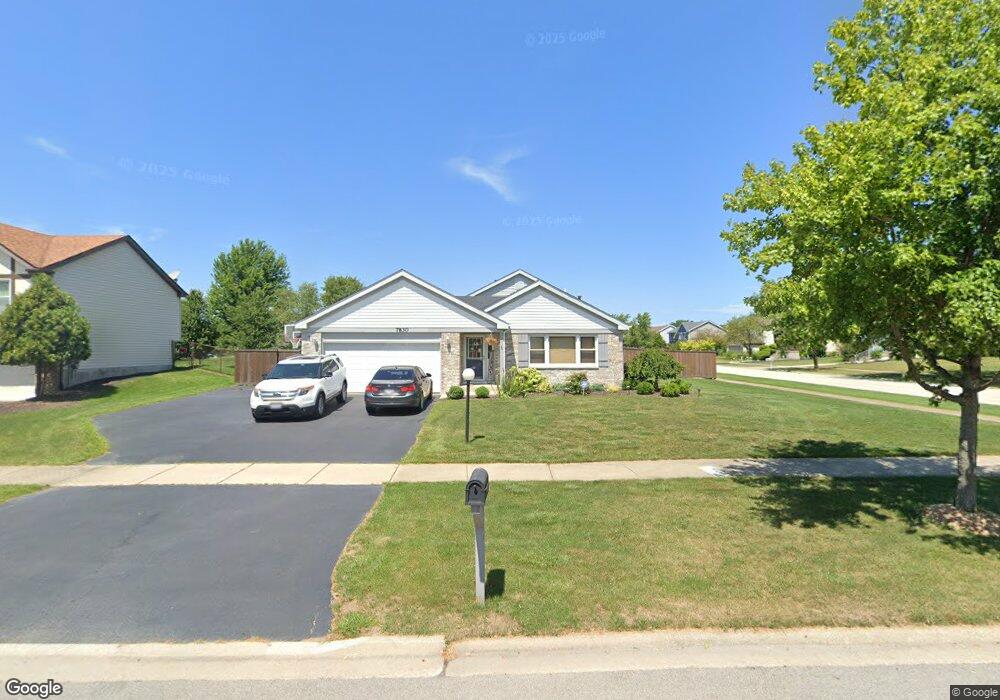
7830 W Frankfort Square Rd Frankfort, IL 60423
Frankfort Square NeighborhoodEstimated Value: $328,000 - $349,000
3
Beds
3
Baths
1,188
Sq Ft
$285/Sq Ft
Est. Value
About This Home
This home is located at 7830 W Frankfort Square Rd, Frankfort, IL 60423 and is currently estimated at $338,775, approximately $285 per square foot. 7830 W Frankfort Square Rd is a home located in Will County with nearby schools including Frankfort Square Elementary School, Summit Hill Junior High School, and Lincoln-Way East High School.
Ownership History
Date
Name
Owned For
Owner Type
Purchase Details
Closed on
Sep 30, 2005
Sold by
Farahat Martha
Bought by
Gabrys John V and Gabrys Deanna M
Current Estimated Value
Home Financials for this Owner
Home Financials are based on the most recent Mortgage that was taken out on this home.
Original Mortgage
$191,600
Outstanding Balance
$103,005
Interest Rate
5.83%
Mortgage Type
Fannie Mae Freddie Mac
Estimated Equity
$235,770
Purchase Details
Closed on
Nov 22, 1999
Sold by
Buikema Barbara Wing and Barkus Ruthie
Bought by
Farahat Martha
Home Financials for this Owner
Home Financials are based on the most recent Mortgage that was taken out on this home.
Original Mortgage
$145,000
Interest Rate
7.97%
Purchase Details
Closed on
Aug 19, 1996
Sold by
Kubik Robert M and Kubik Karen S
Bought by
Buikema Barbara and Barkus Ruthie
Home Financials for this Owner
Home Financials are based on the most recent Mortgage that was taken out on this home.
Original Mortgage
$128,000
Interest Rate
8.47%
Create a Home Valuation Report for This Property
The Home Valuation Report is an in-depth analysis detailing your home's value as well as a comparison with similar homes in the area
Home Values in the Area
Average Home Value in this Area
Purchase History
| Date | Buyer | Sale Price | Title Company |
|---|---|---|---|
| Gabrys John V | $239,500 | First American Title | |
| Farahat Martha | $162,000 | Chicago Title Insurance Co | |
| Buikema Barbara | $163,000 | Chicago Title Insurance Co |
Source: Public Records
Mortgage History
| Date | Status | Borrower | Loan Amount |
|---|---|---|---|
| Open | Gabrys John V | $191,600 | |
| Previous Owner | Farahat Martha | $145,000 | |
| Previous Owner | Buikema Barbara | $128,000 |
Source: Public Records
Tax History Compared to Growth
Tax History
| Year | Tax Paid | Tax Assessment Tax Assessment Total Assessment is a certain percentage of the fair market value that is determined by local assessors to be the total taxable value of land and additions on the property. | Land | Improvement |
|---|---|---|---|---|
| 2024 | $7,137 | $92,617 | $18,195 | $74,422 |
| 2023 | $7,137 | $82,716 | $16,250 | $66,466 |
| 2022 | $6,331 | $75,340 | $14,801 | $60,539 |
| 2021 | $5,924 | $70,484 | $13,847 | $56,637 |
| 2020 | $5,827 | $68,498 | $13,457 | $55,041 |
| 2019 | $5,628 | $66,665 | $13,097 | $53,568 |
| 2018 | $5,416 | $64,748 | $12,720 | $52,028 |
| 2017 | $5,298 | $63,237 | $12,423 | $50,814 |
| 2016 | $5,128 | $61,069 | $11,997 | $49,072 |
| 2015 | $4,796 | $58,919 | $11,575 | $47,344 |
| 2014 | $4,796 | $58,510 | $11,495 | $47,015 |
| 2013 | $4,796 | $59,269 | $11,644 | $47,625 |
Source: Public Records
Map
Nearby Homes
- 8025 Stonegate Dr
- 7959 Brookside Glen Dr Unit VI
- 20027 S Jessica Ln
- 8131 W Evergreen Dr
- 7905 Richardson Ln
- 7758 W Kingston Dr
- 7800 W Kingston Dr
- 8124 Glenbrook Place Unit 1
- 19708 S Skye Dr
- 7928 Trinity Cir Unit 2SW
- 7928 Trinity Cir Unit 3NW
- 20137 S Hampton Ct Unit A
- 7407 Ridgefield Ln
- 8026 Bradley Dr
- 20130 S Frankfort Square Rd
- 7752 W Almond Ct Unit 135
- 7716 Greenway Blvd Unit 1SW
- 19642 S Edinburgh Ln
- 20158 S Rosewood Dr
- 20206 S Frankfort Square Rd Unit A
- 7838 W Frankfort Square Rd
- 7831 W Evan Terrace
- 7839 W Evan Terrace
- 7823 W Frankfort Square Rd
- 7848 W Frankfort Square Rd
- 19749 S Patricia Ln
- 7839 W Carrie Ct
- 19741 S Patricia Ln
- 7849 W Evan Terrace
- 19733 S Patricia Ln
- 7809 W Frankfort Square Rd
- 7815 W Frankfort Square Rd
- 19725 S Patricia Ln
- 7859 W Evan Terrace
- 7851 W Frankfort Square Rd
- 7860 W Frankfort Square Rd
- 7843 W Carrie Ct
- 7830 W Evan Terrace
- 7838 W Evan Terrace
- 19726 S Skidmore Ct