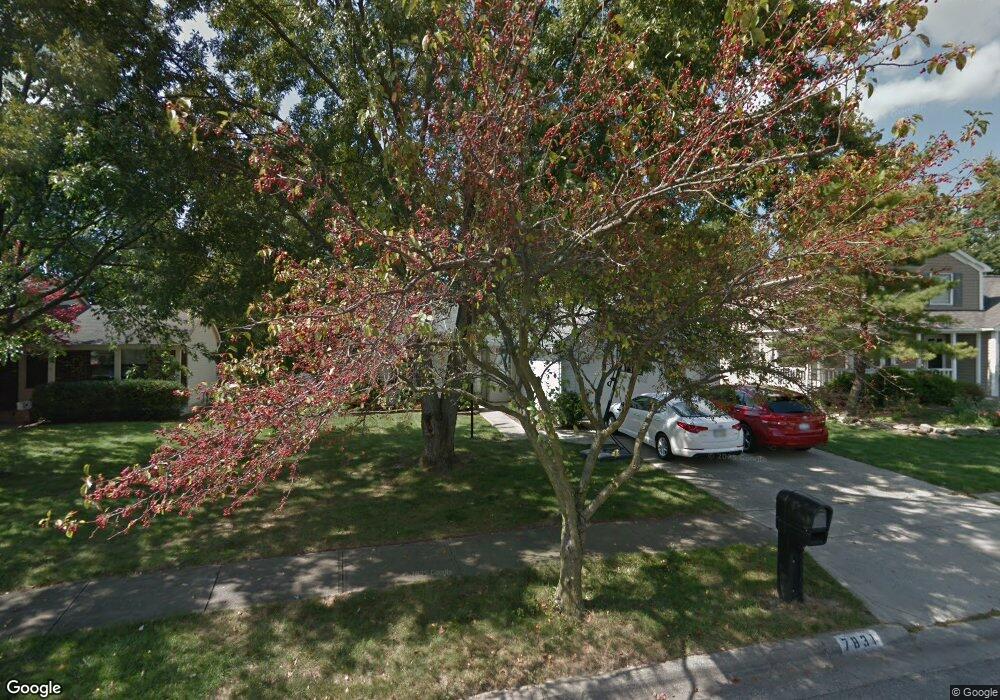
7831 Stanburn Rd Columbus, OH 43235
Foxboro NeighborhoodEstimated Value: $306,000 - $335,000
3
Beds
2
Baths
1,248
Sq Ft
$257/Sq Ft
Est. Value
About This Home
This home is located at 7831 Stanburn Rd, Columbus, OH 43235 and is currently estimated at $320,992, approximately $257 per square foot. 7831 Stanburn Rd is a home located in Franklin County with nearby schools including Albert Chapman Elementary School, Ann Simpson Davis Middle School, and Dublin Scioto High School.
Ownership History
Date
Name
Owned For
Owner Type
Purchase Details
Closed on
May 24, 2016
Sold by
Papikyants Artem
Bought by
Papikyants Liliya V
Current Estimated Value
Home Financials for this Owner
Home Financials are based on the most recent Mortgage that was taken out on this home.
Original Mortgage
$121,520
Outstanding Balance
$96,517
Interest Rate
3.59%
Mortgage Type
New Conventional
Estimated Equity
$224,475
Purchase Details
Closed on
Nov 20, 2009
Sold by
Fravor Kenneth and Fravor Madeline
Bought by
Papikyants Artem
Home Financials for this Owner
Home Financials are based on the most recent Mortgage that was taken out on this home.
Original Mortgage
$147,232
Interest Rate
4.95%
Mortgage Type
FHA
Purchase Details
Closed on
Nov 18, 1997
Sold by
Kallmerten Erin W and Barth Kallmerten R
Bought by
Fravor Kenneth and Fravor Madeline
Purchase Details
Closed on
May 20, 1997
Sold by
Kallmerten Erin W and Wheary Erin E
Bought by
Kallmerten Erin W and Barth Kallmerten R
Purchase Details
Closed on
Feb 1, 1987
Create a Home Valuation Report for This Property
The Home Valuation Report is an in-depth analysis detailing your home's value as well as a comparison with similar homes in the area
Home Values in the Area
Average Home Value in this Area
Purchase History
| Date | Buyer | Sale Price | Title Company |
|---|---|---|---|
| Papikyants Liliya V | $132,000 | Transcounty Title Agency | |
| Papikyants Artem | $150,000 | Powell Tit | |
| Fravor Kenneth | $97,500 | Franklin Abstract | |
| Kallmerten Erin W | -- | -- | |
| -- | $67,000 | -- |
Source: Public Records
Mortgage History
| Date | Status | Borrower | Loan Amount |
|---|---|---|---|
| Open | Papikyants Liliya V | $121,520 | |
| Previous Owner | Papikyants Artem | $147,232 |
Source: Public Records
Tax History Compared to Growth
Tax History
| Year | Tax Paid | Tax Assessment Tax Assessment Total Assessment is a certain percentage of the fair market value that is determined by local assessors to be the total taxable value of land and additions on the property. | Land | Improvement |
|---|---|---|---|---|
| 2024 | $5,096 | $84,250 | $34,300 | $49,950 |
| 2023 | $5,024 | $84,245 | $34,300 | $49,945 |
| 2022 | $3,791 | $59,080 | $17,850 | $41,230 |
| 2021 | $3,852 | $59,080 | $17,850 | $41,230 |
| 2020 | $3,829 | $59,080 | $17,850 | $41,230 |
| 2019 | $3,537 | $48,310 | $14,880 | $33,430 |
| 2018 | $3,613 | $48,310 | $14,880 | $33,430 |
| 2017 | $3,459 | $48,310 | $14,880 | $33,430 |
| 2016 | $3,652 | $50,750 | $14,140 | $36,610 |
| 2015 | $3,675 | $50,750 | $14,140 | $36,610 |
| 2014 | $3,678 | $50,750 | $14,140 | $36,610 |
| 2013 | $1,867 | $50,750 | $14,140 | $36,610 |
Source: Public Records
Map
Nearby Homes
- 2469 Sandstrom Dr
- 2462 Sanford Dr
- 2456 Sanford Dr
- 2488 Dunstan Dr
- 2392 Dunsworth Dr
- 2423 Sutter Pkwy
- 7871 Thornfield Ln
- 7917 Meadowhaven Blvd Unit 11
- 2620 Cedar Lake Dr Unit 2620
- 2220 Surreygate Dr
- 2475 Slateshire Dr
- 7607-7609 Penwood Place
- 3915 Inverness Cir Unit 3915
- 2074 Hard Rd
- 7373 Palmleaf Ln
- 2161 Heatherfield Ave
- 7385 Cimmaron Station
- 1996 Starbridge Ct
- 2001 Sawbury Blvd Unit 2001
- 7774 Essex Gate Dr S Unit 7774
- 7825 Stanburn Rd
- 7837 Stanburn Rd
- 7819 Stanburn Rd
- 7843 Stanburn Rd
- 7813 Stanburn Rd
- 7834 Stanburn Rd
- 7840 Stanburn Rd
- 7849 Stanburn Rd
- 0 Sandstrom Dr
- 7846 Stanburn Rd
- 7807 Stanburn Rd
- 2477 Sandstrom Dr
- 7855 Stanburn Rd
- 7852 Stanburn Rd
- 2464 Sandstrom Dr
- 2533 Hard Rd
- 2533 Hard Rd
- 7801 Stanburn Rd
- 7894 Fairwind Dr
- 2505 Dunstan Dr