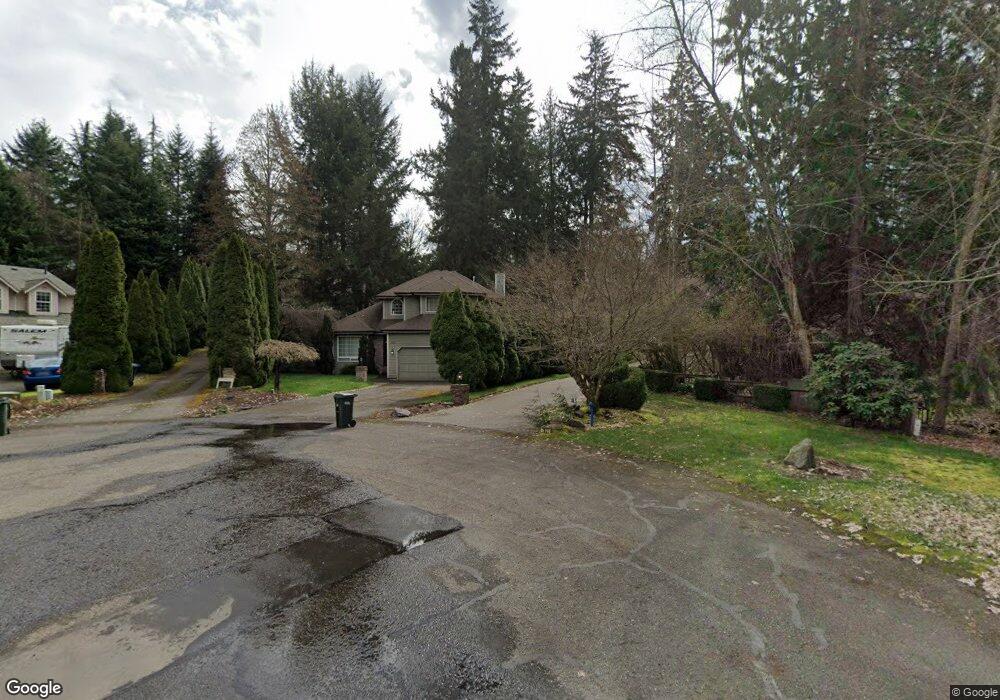
7832 195th Avenue Ct E Bonney Lake, WA 98391
Estimated Value: $544,000 - $599,000
3
Beds
3
Baths
1,616
Sq Ft
$350/Sq Ft
Est. Value
About This Home
This home is located at 7832 195th Avenue Ct E, Bonney Lake, WA 98391 and is currently estimated at $566,338, approximately $350 per square foot. 7832 195th Avenue Ct E is a home located in Pierce County with nearby schools including Bonney Lake Elementary School, Lakeridge Middle School, and Bonney Lake High School.
Ownership History
Date
Name
Owned For
Owner Type
Purchase Details
Closed on
Sep 30, 2025
Sold by
Wells Sharon K and Wells Frederick R
Bought by
Wells Frederick R
Current Estimated Value
Purchase Details
Closed on
Jun 16, 2005
Sold by
Kinderknecht Korrina
Bought by
Wells Frederick R and Wells Sharon K
Home Financials for this Owner
Home Financials are based on the most recent Mortgage that was taken out on this home.
Original Mortgage
$184,000
Interest Rate
5.72%
Mortgage Type
Fannie Mae Freddie Mac
Purchase Details
Closed on
Oct 23, 1997
Sold by
Hursey Donald E
Bought by
Kinderknecht Korrina and Campbell Duncan
Home Financials for this Owner
Home Financials are based on the most recent Mortgage that was taken out on this home.
Original Mortgage
$137,117
Interest Rate
7.36%
Mortgage Type
FHA
Purchase Details
Closed on
Aug 8, 1997
Sold by
Bangert Hursey Janice
Bought by
Hursey Donald E
Create a Home Valuation Report for This Property
The Home Valuation Report is an in-depth analysis detailing your home's value as well as a comparison with similar homes in the area
Home Values in the Area
Average Home Value in this Area
Purchase History
| Date | Buyer | Sale Price | Title Company |
|---|---|---|---|
| Wells Frederick R | -- | None Listed On Document | |
| Wells Frederick R | $230,000 | Fidelity National Title | |
| Kinderknecht Korrina | $139,000 | Transnation Title Insurance | |
| Hursey Donald E | -- | -- |
Source: Public Records
Mortgage History
| Date | Status | Borrower | Loan Amount |
|---|---|---|---|
| Previous Owner | Wells Frederick R | $184,000 | |
| Previous Owner | Kinderknecht Korrina | $137,117 | |
| Closed | Wells Frederick R | $23,000 |
Source: Public Records
Tax History Compared to Growth
Tax History
| Year | Tax Paid | Tax Assessment Tax Assessment Total Assessment is a certain percentage of the fair market value that is determined by local assessors to be the total taxable value of land and additions on the property. | Land | Improvement |
|---|---|---|---|---|
| 2025 | $4,784 | $530,000 | $257,300 | $272,700 |
| 2024 | $4,784 | $509,000 | $201,300 | $307,700 |
| 2023 | $4,784 | $470,300 | $196,400 | $273,900 |
| 2022 | $4,821 | $496,100 | $215,800 | $280,300 |
| 2021 | $4,673 | $358,700 | $151,300 | $207,400 |
| 2019 | $3,938 | $334,100 | $130,400 | $203,700 |
| 2018 | $4,042 | $319,400 | $120,100 | $199,300 |
| 2017 | $3,370 | $288,400 | $100,100 | $188,300 |
| 2016 | $2,880 | $226,700 | $72,900 | $153,800 |
| 2014 | $2,722 | $203,600 | $62,500 | $141,100 |
| 2013 | $2,722 | $185,000 | $59,300 | $125,700 |
Source: Public Records
Map
Nearby Homes
- 19511 Church Lake Rd E
- 19308 78th St E
- 19503 82nd Street Ct E
- 19708 82nd Street Ct E
- 19306 Evergreen Dr
- 19204 Evergreen Dr
- 7510 193rd Ave E
- 7510 193rd Ave E Unit 1&2
- 19314 75th St E
- 7715 202nd Ave E
- 7711 202nd Ave E
- 20221 Church Lake Rd E
- 20315 79th St E
- 20506 80th St E
- 20425 Myrtle Place E
- 7212 188th Ave E
- 8007 Locust Ave E
- 6707 W Lake Tapps Hwy E
- 7513 Locust Extension E
- 7515 Locust Extension E
- 7826 195th Avenue Ct E
- 7831 195th Avenue Ct E
- 7820 195th Avenue Ct E
- 7905 197th Ave E
- 7901 197th Ave E
- 7835 197th Ave E
- 7814 195th Avenue Ct E
- 7903 197th Ave E
- 7823 197th Ave E
- 7909 197th Ave E
- 7810 194th Ave E
- 7808 195th Avenue Ct E
- 13408 187th Avenue Ct E
- 7813 195th Avenue Ct E
- 7817 197th Ave E
- 7808 194th Ave E
- 19313 79th St E
- 7807 195th Avenue Ct E
- 8001 196th Ave E
- 7828 197th Ave E