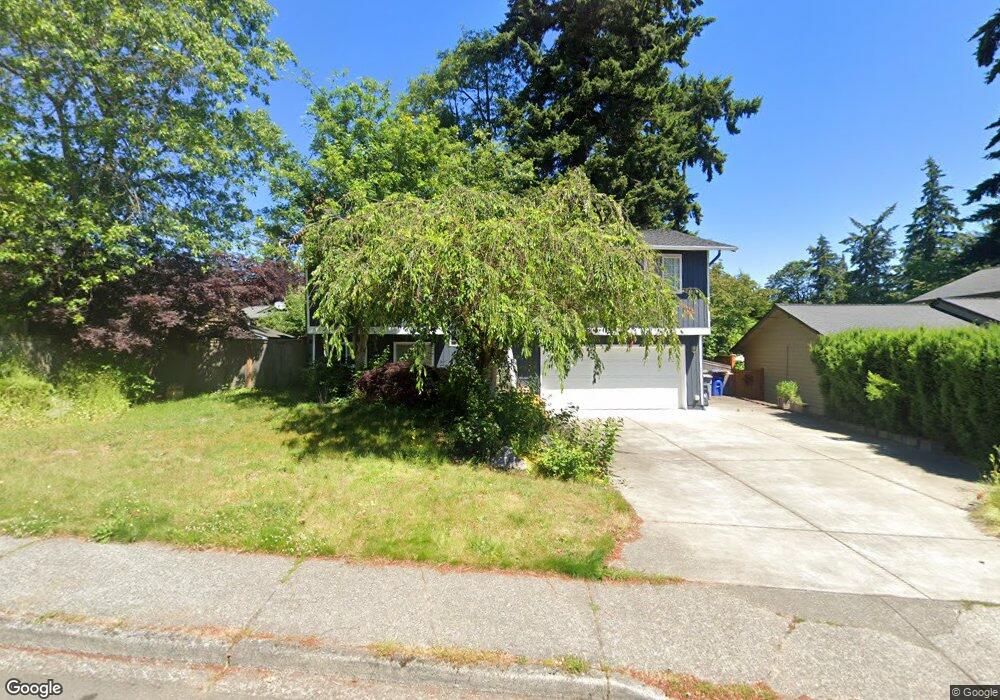
7834 NE 145th St Kenmore, WA 98028
Moorlands NeighborhoodEstimated Value: $850,000 - $921,241
3
Beds
3
Baths
1,080
Sq Ft
$822/Sq Ft
Est. Value
About This Home
This home is located at 7834 NE 145th St, Kenmore, WA 98028 and is currently estimated at $887,310, approximately $821 per square foot. 7834 NE 145th St is a home located in King County with nearby schools including Moorlands Elementary School, Northshore Junior High School, and Inglemoor High School.
Ownership History
Date
Name
Owned For
Owner Type
Purchase Details
Closed on
Mar 10, 2004
Sold by
Kent Christopher P and Kent Lindsey C
Bought by
Mar Richard and Mar Yasmeen T
Current Estimated Value
Home Financials for this Owner
Home Financials are based on the most recent Mortgage that was taken out on this home.
Original Mortgage
$240,923
Outstanding Balance
$112,439
Interest Rate
5.65%
Mortgage Type
Credit Line Revolving
Estimated Equity
$774,871
Purchase Details
Closed on
Jan 19, 2001
Sold by
Fagan Patrick and Jones Fagan Kelly R
Bought by
Kent Christopher P and Kent Lindsey C
Home Financials for this Owner
Home Financials are based on the most recent Mortgage that was taken out on this home.
Original Mortgage
$242,200
Interest Rate
7.41%
Purchase Details
Closed on
Dec 10, 1997
Sold by
Johnson Michael L and Rogers Katherine
Bought by
Fagan Patrick and Jones Fagan Kelly R
Home Financials for this Owner
Home Financials are based on the most recent Mortgage that was taken out on this home.
Original Mortgage
$148,800
Interest Rate
7.19%
Purchase Details
Closed on
Aug 26, 1992
Sold by
Milne David R and Milne Colleen M
Bought by
Johnson Michael L and Johnson Katherine
Create a Home Valuation Report for This Property
The Home Valuation Report is an in-depth analysis detailing your home's value as well as a comparison with similar homes in the area
Home Values in the Area
Average Home Value in this Area
Purchase History
| Date | Buyer | Sale Price | Title Company |
|---|---|---|---|
| Mar Richard | $269,000 | Lawyers Title | |
| Kent Christopher P | $249,700 | Chicago Title | |
| Fagan Patrick | $186,000 | -- | |
| Johnson Michael L | $129,000 | -- |
Source: Public Records
Mortgage History
| Date | Status | Borrower | Loan Amount |
|---|---|---|---|
| Open | Mar Richard | $240,923 | |
| Previous Owner | Kent Christopher P | $242,200 | |
| Previous Owner | Fagan Patrick | $148,800 |
Source: Public Records
Tax History Compared to Growth
Tax History
| Year | Tax Paid | Tax Assessment Tax Assessment Total Assessment is a certain percentage of the fair market value that is determined by local assessors to be the total taxable value of land and additions on the property. | Land | Improvement |
|---|---|---|---|---|
| 2024 | $8,301 | $809,000 | $452,000 | $357,000 |
| 2023 | $7,432 | $693,000 | $369,000 | $324,000 |
| 2022 | $7,122 | $868,000 | $440,000 | $428,000 |
| 2021 | $6,572 | $633,000 | $320,000 | $313,000 |
| 2020 | $6,522 | $534,000 | $265,000 | $269,000 |
| 2018 | $5,223 | $464,000 | $250,000 | $214,000 |
| 2017 | $4,896 | $414,000 | $223,000 | $191,000 |
| 2016 | $4,675 | $392,000 | $211,000 | $181,000 |
| 2015 | $4,509 | $371,000 | $200,000 | $171,000 |
| 2014 | -- | $343,000 | $182,000 | $161,000 |
| 2013 | -- | $282,000 | $150,000 | $132,000 |
Source: Public Records
Map
Nearby Homes
- 8031 NE 145th St
- 7419 NE 145th St
- 7728 NE 151st Ln
- 15031 78th Ave NE
- 14911 84th Ave NE
- 15115 78th Ave NE
- 8254 NE 143rd Place
- 7328 NE 142nd Place Unit 5D
- 14808 84th Ave NE
- 14132 74th Place NE Unit 16D
- 7802 NE 140th Place
- 14933 73rd Ave NE
- 8746 NE 144th Ct
- 7609 NE 155th St
- 16 Xxx 76th Place NE
- 14711 70th Ct NE
- 15505 81st Ave NE
- 14020 Juanita Dr NE Unit B3
- 6835 NE 153rd Place Unit C201
- 15000 Juanita Dr NE Unit 405
- 7840 NE 145th St
- 14506 78th Place NE
- 14514 78th Place NE
- 7846 NE 145th St
- 7837 NE 146th St
- 7843 NE 146th St
- 7831 NE 146th St
- 7835 NE 145th St
- 7827 NE 145th St
- 7841 NE 145th St
- 7841 NE 145th St
- 7819 NE 145th St
- 7854 NE 145th St
- 7819 NE 145th St
- 14505 78th Place NE
- 14513 78th Place NE
- 7849 NE 146th St
- 14413 79th Place NE
- 14519 78th Place NE
- 7813 NE 145th St