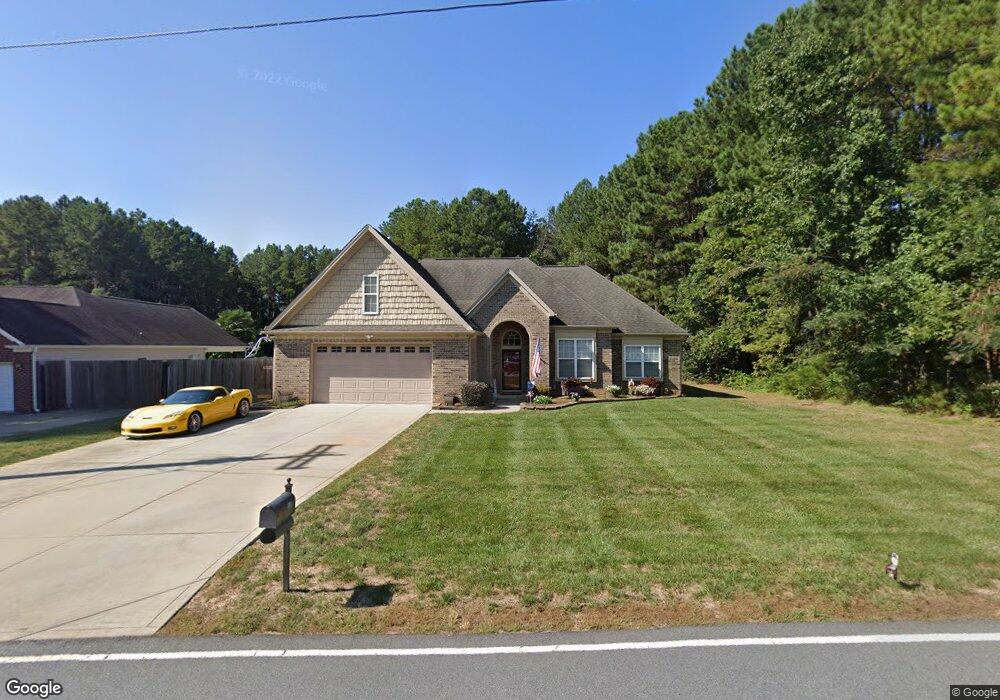
7835 Windy Pine Cir Denver, NC 28037
Estimated Value: $456,000 - $540,000
3
Beds
2
Baths
1,524
Sq Ft
$322/Sq Ft
Est. Value
About This Home
This home is located at 7835 Windy Pine Cir, Denver, NC 28037 and is currently estimated at $490,218, approximately $321 per square foot. 7835 Windy Pine Cir is a home located in Lincoln County with nearby schools including Rock Springs Elementary School, North Lincoln Middle School, and North Lincoln High School.
Ownership History
Date
Name
Owned For
Owner Type
Purchase Details
Closed on
Dec 6, 2018
Sold by
Comelius Marlin E
Bought by
Cardoza Tara M and Cardoza Kevin
Current Estimated Value
Home Financials for this Owner
Home Financials are based on the most recent Mortgage that was taken out on this home.
Original Mortgage
$281,801
Outstanding Balance
$247,367
Interest Rate
4.62%
Mortgage Type
FHA
Estimated Equity
$242,851
Purchase Details
Closed on
Jan 27, 2005
Sold by
Harper Michae E and Harper Cynthia S
Bought by
Cornelius Marlin E
Home Financials for this Owner
Home Financials are based on the most recent Mortgage that was taken out on this home.
Original Mortgage
$29,796
Interest Rate
5.62%
Mortgage Type
Seller Take Back
Purchase Details
Closed on
Aug 10, 2004
Bought by
Harper Michael E
Purchase Details
Closed on
Mar 7, 2001
Bought by
Boyce Marilyn
Purchase Details
Closed on
Dec 9, 1999
Bought by
Sandpiper Bay Of Denver, Llc
Create a Home Valuation Report for This Property
The Home Valuation Report is an in-depth analysis detailing your home's value as well as a comparison with similar homes in the area
Purchase History
| Date | Buyer | Sale Price | Title Company |
|---|---|---|---|
| Cardoza Tara M | $287,000 | None Available | |
| Cornelius Marlin E | $198,500 | None Available | |
| Harper Michael E | $38,000 | -- | |
| Boyce Marilyn | $24,900 | -- | |
| Sandpiper Bay Of Denver, Llc | $900,000 | -- |
Source: Public Records
Mortgage History
| Date | Status | Borrower | Loan Amount |
|---|---|---|---|
| Open | Cardoza Tara M | $281,801 | |
| Previous Owner | Cornelius Marlin E | $29,796 |
Source: Public Records
Tax History
| Year | Tax Paid | Tax Assessment Tax Assessment Total Assessment is a certain percentage of the fair market value that is determined by local assessors to be the total taxable value of land and additions on the property. | Land | Improvement |
|---|---|---|---|---|
| 2025 | $2,907 | $457,407 | $81,536 | $375,871 |
| 2024 | $2,878 | $457,407 | $81,536 | $375,871 |
| 2023 | $2,873 | $457,407 | $81,536 | $375,871 |
| 2022 | $1,895 | $240,165 | $58,962 | $181,203 |
| 2021 | $1,878 | $240,165 | $58,962 | $181,203 |
| 2020 | $1,715 | $240,165 | $58,962 | $181,203 |
| 2019 | $1,715 | $240,165 | $58,962 | $181,203 |
| 2018 | $1,755 | $208,264 | $55,275 | $152,989 |
| 2017 | $1,512 | $208,264 | $55,275 | $152,989 |
| 2016 | $1,507 | $208,264 | $55,275 | $152,989 |
| 2015 | $1,733 | $208,264 | $55,275 | $152,989 |
| 2014 | $1,580 | $211,577 | $58,588 | $152,989 |
Source: Public Records
Map
Nearby Homes
- #22 & #23 Windy Pine Cir
- 4677 Stratford Ln
- 7717 Nautical View
- 4067 Rivendell Rd
- 4028 Spindrift Cove Unit 60
- 6840 Kingfisher Ct
- 7653 Juniper Ln
- 0000 Spindrift Cove Unit 59
- 4237 Little Fork Cove Rd
- 4021 Harmattan Dr
- 6774 Kingfisher Ct
- 000 Rivendell Rd Unit 40
- #19 Juniper Ln
- 7656 Juniper Ln Unit 15
- 3227 Cape Fox Ct
- 7727 Juniper Ln
- 7722 Juniper Ln
- 0000 Webbs Rd
- 7608 Webbs Chapel Cove Ct
- 4307 Island Fox Ln
- 7825 Windy Pine Cir
- 7857 Windy Pine Cir
- 7857 Windy Pine Cir Unit 10
- 7813 Windy Pine Cir
- 7850 Windy Pine Cir
- 7832 Windy Pine Cir
- 7820 Windy Pine Cir
- Lot B Windy Pine Cir
- 7801 Windy Pine Cir
- 7384 Pine Ridge Dr
- 7810 Windy Pine Cir
- 000 Windy Pine Cir Unit 21
- 7800 Windy Pine Cir
- 7396 Pine Ridge Dr
- lot 3 Pine Ridge Dr Unit 3
- 7791 Windy Pine Cir
- lot 21 Windy Pine Cir Unit 21
- 4487 Ivy Run Ln
- 4477 Ivy Run Ln
- 7695 Windy Pine Cir
Your Personal Tour Guide
Ask me questions while you tour the home.