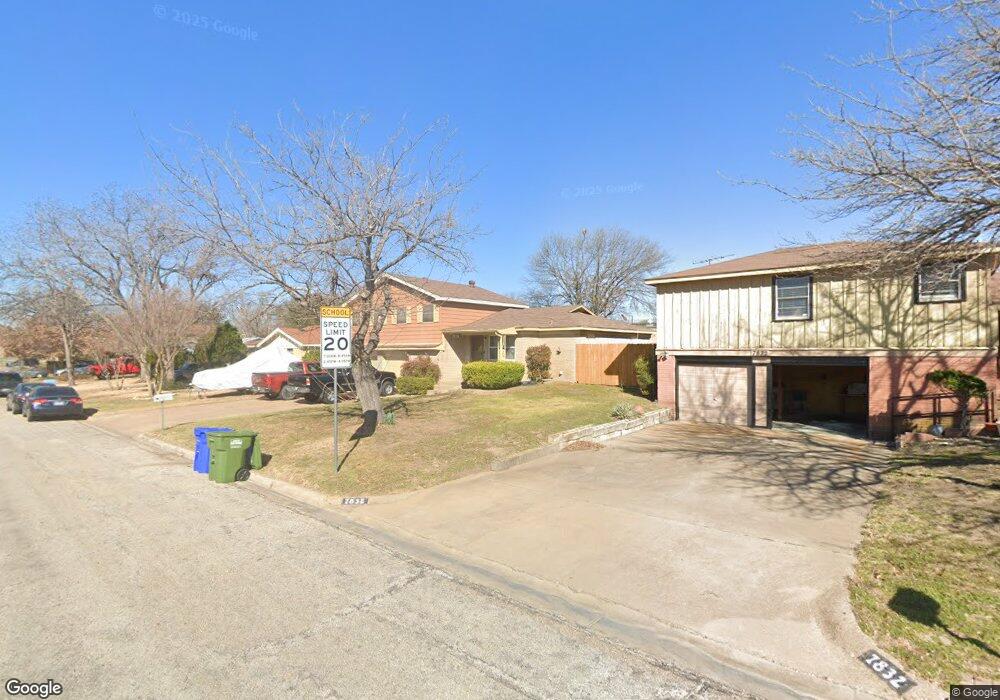
7836 Abbott Dr Fort Worth, TX 76108
Estimated Value: $224,000 - $268,094
4
Beds
2
Baths
1,504
Sq Ft
$161/Sq Ft
Est. Value
About This Home
This home is located at 7836 Abbott Dr, Fort Worth, TX 76108 and is currently estimated at $241,774, approximately $160 per square foot. 7836 Abbott Dr is a home located in Tarrant County with nearby schools including Liberty Elementary School, Brewer Middle School, and Tannahill Intermediate School.
Ownership History
Date
Name
Owned For
Owner Type
Purchase Details
Closed on
Jul 12, 2022
Sold by
Ward Frances A and Vanwinkle Dawn M
Bought by
Phillips Kayla Ann and Jordan Nicholas Ryan
Current Estimated Value
Home Financials for this Owner
Home Financials are based on the most recent Mortgage that was taken out on this home.
Original Mortgage
$150,000
Outstanding Balance
$125,984
Interest Rate
4.81%
Mortgage Type
New Conventional
Estimated Equity
$115,790
Purchase Details
Closed on
Mar 18, 2013
Sold by
Vanwinkle Jerry D
Bought by
Vanwinkle Dawn M and Ward Frances A
Purchase Details
Closed on
May 13, 1996
Sold by
Neel James Boyd and Neel Anita
Bought by
Winkle Jerry Don Van
Create a Home Valuation Report for This Property
The Home Valuation Report is an in-depth analysis detailing your home's value as well as a comparison with similar homes in the area
Home Values in the Area
Average Home Value in this Area
Purchase History
| Date | Buyer | Sale Price | Title Company |
|---|---|---|---|
| Phillips Kayla Ann | -- | Stewart Title | |
| Vanwinkle Dawn M | -- | None Available | |
| Winkle Jerry Don Van | -- | Fidelity National Title |
Source: Public Records
Mortgage History
| Date | Status | Borrower | Loan Amount |
|---|---|---|---|
| Open | Phillips Kayla Ann | $150,000 |
Source: Public Records
Tax History Compared to Growth
Tax History
| Year | Tax Paid | Tax Assessment Tax Assessment Total Assessment is a certain percentage of the fair market value that is determined by local assessors to be the total taxable value of land and additions on the property. | Land | Improvement |
|---|---|---|---|---|
| 2025 | $3,980 | $240,517 | $50,542 | $189,975 |
| 2024 | $3,980 | $240,517 | $50,542 | $189,975 |
| 2023 | $6,279 | $264,077 | $50,542 | $213,535 |
| 2022 | $3,993 | $192,624 | $25,000 | $167,624 |
| 2021 | $3,687 | $181,500 | $25,000 | $156,500 |
| 2020 | $3,376 | $160,662 | $25,000 | $135,662 |
| 2019 | $3,187 | $161,800 | $25,000 | $136,800 |
| 2018 | $1,022 | $100,707 | $12,000 | $88,707 |
| 2017 | $2,675 | $128,033 | $12,000 | $116,033 |
| 2016 | $2,432 | $83,229 | $12,000 | $71,229 |
| 2015 | $880 | $78,600 | $9,000 | $69,600 |
| 2014 | $880 | $78,600 | $9,000 | $69,600 |
Source: Public Records
Map
Nearby Homes