7836 Fashion Loop New Port Richey, FL 34654
River Ridge NeighborhoodEstimated Value: $289,205 - $320,000
About This Home
Please note, our homes are available on a first-come, first-serve basis and are not reserved until the lease is signed by all applicants and security deposits are collected.
This home features Progress Smart Home - Progress Residential's smart home app, which allows you to control the home securely from any of your devices. Learn more at
Want to tour on your own? Click the “Self Tour” button on this home’s listing or call to register for a self-guided showing at a time that works best for you.
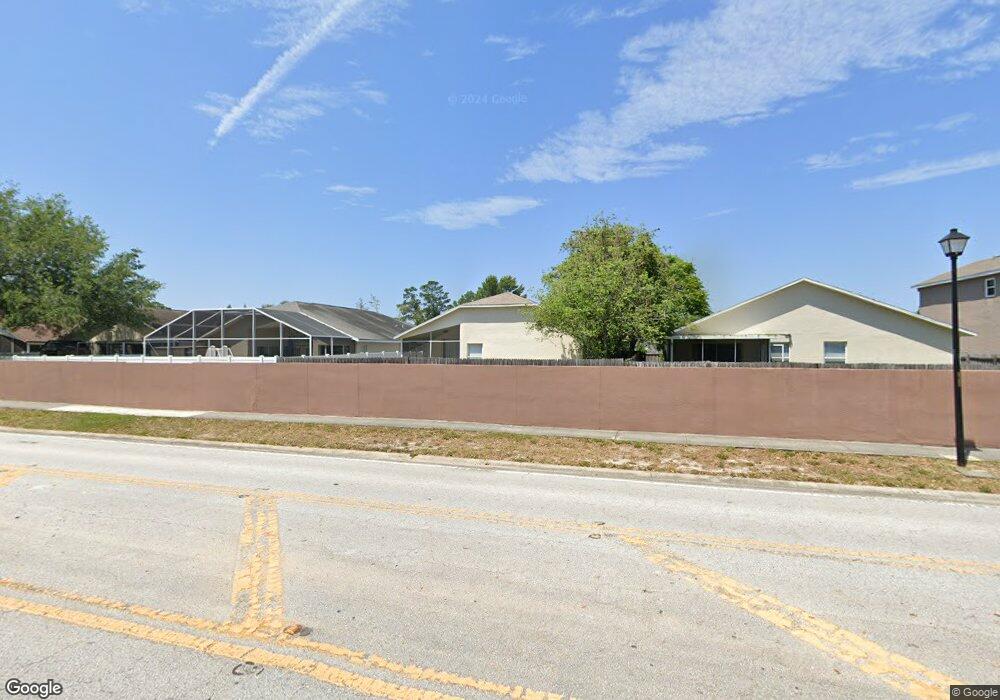
Gorgeous 3 bedroom, 2 bathroom home for rent in New Port Richey, FL! You will love the open floor plan, complete with a vaulted family room that flows into the kitchen. The kitchen includes a breakfast bar and a dining area. All three bedrooms are generously sized and the master bath boasts a private bath with a dual sink vanity, separate shower and garden tub. The screened, covered patio overlooks the fenced backyard. Schedule your tour and submit your application online at today!
Ownership History
Purchase Details
Purchase Details
Purchase Details
Purchase Details
Home Values in the Area
Average Home Value in this Area
Purchase History
| Date | Buyer | Sale Price | Title Company |
|---|---|---|---|
| Progress Residential 2015-3 Borrower Llc | -- | Attorney | |
| Freo Florida Llc | $124,000 | None Available | |
| Federal National Mortgage Association | $121,200 | Attorney | |
| The Bank Of New York Mellon | -- | None Available |
Property History
| Date | Event | Price | List to Sale | Price per Sq Ft |
|---|---|---|---|---|
| 12/13/2024 12/13/24 | Off Market | $1,870 | -- | -- |
| 12/09/2024 12/09/24 | Price Changed | $1,870 | -1.6% | $1 / Sq Ft |
| 12/06/2024 12/06/24 | Price Changed | $1,900 | -10.2% | $1 / Sq Ft |
| 12/04/2024 12/04/24 | Price Changed | $2,115 | -0.7% | $1 / Sq Ft |
| 12/03/2024 12/03/24 | Price Changed | $2,130 | -2.3% | $1 / Sq Ft |
| 11/27/2024 11/27/24 | Price Changed | $2,180 | -1.8% | $1 / Sq Ft |
| 11/26/2024 11/26/24 | Price Changed | $2,220 | -0.2% | $1 / Sq Ft |
| 11/22/2024 11/22/24 | Price Changed | $2,225 | +1.6% | $1 / Sq Ft |
| 11/21/2024 11/21/24 | Price Changed | $2,190 | +0.2% | $1 / Sq Ft |
| 11/20/2024 11/20/24 | Price Changed | $2,185 | -2.2% | $1 / Sq Ft |
| 11/17/2024 11/17/24 | Price Changed | $2,235 | +0.2% | $1 / Sq Ft |
| 11/16/2024 11/16/24 | Price Changed | $2,230 | -1.5% | $1 / Sq Ft |
| 11/13/2024 11/13/24 | Price Changed | $2,265 | -0.4% | $1 / Sq Ft |
| 11/09/2024 11/09/24 | Price Changed | $2,275 | +5.8% | $2 / Sq Ft |
| 11/07/2024 11/07/24 | Price Changed | $2,150 | -3.8% | $1 / Sq Ft |
| 11/05/2024 11/05/24 | Price Changed | $2,235 | -4.3% | $1 / Sq Ft |
| 11/03/2024 11/03/24 | Price Changed | $2,335 | +0.2% | $2 / Sq Ft |
| 11/01/2024 11/01/24 | Price Changed | $2,330 | -36.3% | $2 / Sq Ft |
| 10/30/2024 10/30/24 | For Rent | $3,660 | +56.4% | -- |
| 10/29/2024 10/29/24 | Price Changed | $2,340 | -0.2% | $2 / Sq Ft |
| 10/28/2024 10/28/24 | Price Changed | $2,345 | +0.2% | $2 / Sq Ft |
| 10/11/2024 10/11/24 | Price Changed | $2,340 | -0.6% | $2 / Sq Ft |
| 10/05/2024 10/05/24 | Price Changed | $2,355 | +0.2% | $2 / Sq Ft |
| 10/04/2024 10/04/24 | Price Changed | $2,350 | +0.4% | $2 / Sq Ft |
| 10/01/2024 10/01/24 | Price Changed | $2,340 | -0.2% | $2 / Sq Ft |
| 09/30/2024 09/30/24 | Price Changed | $2,345 | +0.2% | $2 / Sq Ft |
| 09/21/2024 09/21/24 | Price Changed | $2,340 | -- | $2 / Sq Ft |
Tax History Compared to Growth
Tax History
| Year | Tax Paid | Tax Assessment Tax Assessment Total Assessment is a certain percentage of the fair market value that is determined by local assessors to be the total taxable value of land and additions on the property. | Land | Improvement |
|---|---|---|---|---|
| 2025 | $4,478 | $275,100 | $46,164 | $228,936 |
| 2024 | $4,478 | $280,490 | $46,164 | $234,326 |
| 2023 | $4,295 | $289,539 | $40,129 | $249,410 |
| 2022 | $3,481 | $237,808 | $33,458 | $204,350 |
| 2021 | $3,046 | $184,419 | $30,017 | $154,402 |
| 2020 | $2,742 | $160,959 | $22,235 | $138,724 |
| 2019 | $2,624 | $154,640 | $22,235 | $132,405 |
| 2018 | $2,406 | $141,166 | $22,235 | $118,931 |
| 2017 | $2,245 | $128,650 | $17,206 | $111,444 |
| 2016 | $2,018 | $113,421 | $17,206 | $96,215 |
| 2015 | $1,941 | $106,505 | $17,206 | $89,299 |
| 2014 | $977 | $94,640 | $16,623 | $78,017 |
Map
- 7825 Burnet Ln
- 7821 Floradora Dr
- 7940 Fashion Loop
- 12031 Penzance Ln
- 12041 Penzance Ln
- 7828 Primula Ln
- 0 Moon Lake Rd Unit MFRW7863538
- 11520 Lounds Ct
- 11418 Tee Time Cir
- 11343 Tee Time Cir
- 11506 Dampier Ct
- 7739 Harbor Bridge Blvd
- 11742 Castine St
- 7814 Brisbane Ct
- 11632 Castine St
- 11805 Castine St
- 12536 Eclipse Ct
- 11149 Port Douglas Dr
- 11311 Striped Bass Ct
- 11324 Striped Bass Ct
- 7840 Fashion Loop
- 7832 Fashion Loop
- 7828 Fashion Loop
- 7844 Fashion Loop
- 7837 Fashion Loop
- 7833 Fashion Loop
- 7841 Fashion Loop
- 7824 Fashion Loop
- 7848 Fashion Loop
- 7829 Fashion Loop
- 7847 Fashion Loop
- 7825 Fashion Loop
- 7818 Fashion Loop
- 7852 Fashion Loop
- 7825 Bengal Ln
- 7817 Fashion Loop
- 7814 Fashion Loop
- 7904 Fashion Loop
- 7821 Bengal Ln
- 7839 Bengal Ln