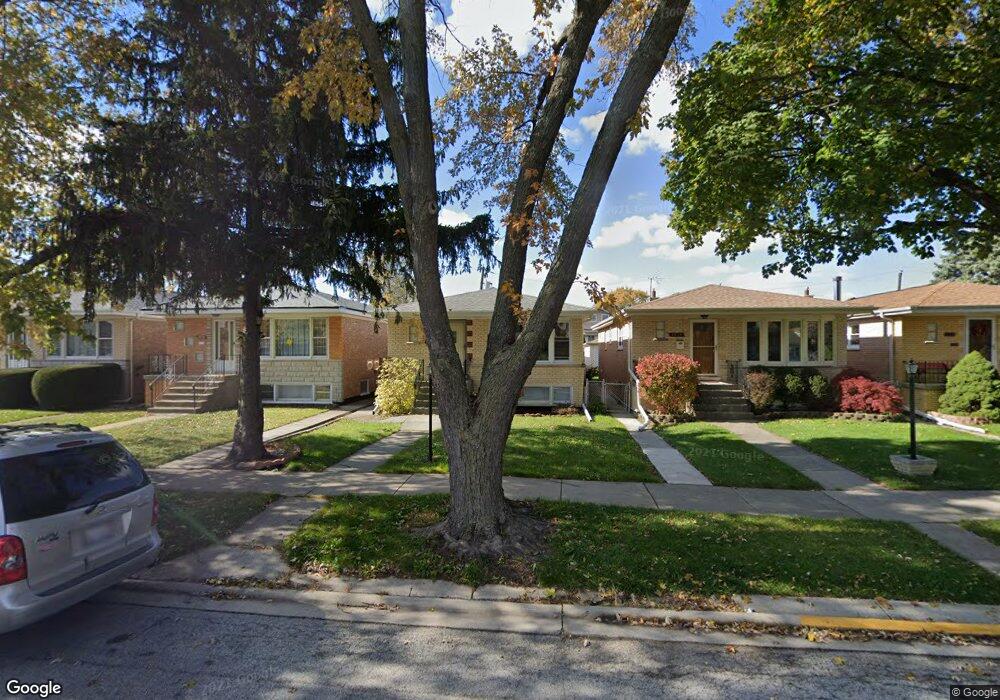
7836 Natchez Ave Burbank, IL 60459
Estimated Value: $304,000 - $350,000
5
Beds
2
Baths
1,056
Sq Ft
$306/Sq Ft
Est. Value
About This Home
This home is located at 7836 Natchez Ave, Burbank, IL 60459 and is currently estimated at $322,743, approximately $305 per square foot. 7836 Natchez Ave is a home located in Cook County with nearby schools including Harry E. Fry School, Reavis High School, and St Albert the Great Catholic School.
Ownership History
Date
Name
Owned For
Owner Type
Purchase Details
Closed on
Oct 3, 2018
Sold by
Kojak Cecylia
Bought by
Kojak Cecylia and Cecylia Kojak Revocable Living Trust
Current Estimated Value
Purchase Details
Closed on
Mar 15, 2017
Sold by
Piecek Marian and Trzcinska Karolina D
Bought by
Kojak Cecylia
Purchase Details
Closed on
Nov 12, 2007
Sold by
Piecek Marian
Bought by
Piecek Marian and Trzcinska Karolina D
Purchase Details
Closed on
Sep 12, 2003
Sold by
Laube David and Laube Noel
Bought by
Piecek Marian
Home Financials for this Owner
Home Financials are based on the most recent Mortgage that was taken out on this home.
Original Mortgage
$190,000
Interest Rate
4.62%
Mortgage Type
Unknown
Purchase Details
Closed on
Jul 1, 2000
Sold by
Firstar Bank Na
Bought by
Laube David L and Laube Noel C
Create a Home Valuation Report for This Property
The Home Valuation Report is an in-depth analysis detailing your home's value as well as a comparison with similar homes in the area
Home Values in the Area
Average Home Value in this Area
Purchase History
| Date | Buyer | Sale Price | Title Company |
|---|---|---|---|
| Kojak Cecylia | -- | Attorney | |
| Kojak Cecylia | $190,000 | Old Republic Title | |
| Piecek Marian | -- | None Available | |
| Piecek Marian | $200,000 | Cti | |
| Laube David L | -- | -- |
Source: Public Records
Mortgage History
| Date | Status | Borrower | Loan Amount |
|---|---|---|---|
| Previous Owner | Piecek Marian | $190,000 |
Source: Public Records
Tax History Compared to Growth
Tax History
| Year | Tax Paid | Tax Assessment Tax Assessment Total Assessment is a certain percentage of the fair market value that is determined by local assessors to be the total taxable value of land and additions on the property. | Land | Improvement |
|---|---|---|---|---|
| 2024 | $7,447 | $21,913 | $3,506 | $18,407 |
| 2023 | $6,073 | $24,001 | $3,506 | $20,495 |
| 2022 | $6,073 | $15,749 | $3,044 | $12,705 |
| 2021 | $5,811 | $15,748 | $3,044 | $12,704 |
| 2020 | $5,606 | $15,748 | $3,044 | $12,704 |
| 2019 | $6,434 | $17,959 | $2,767 | $15,192 |
| 2018 | $6,251 | $17,959 | $2,767 | $15,192 |
| 2017 | $4,908 | $17,959 | $2,767 | $15,192 |
| 2016 | $3,877 | $13,500 | $2,306 | $11,194 |
| 2015 | $3,690 | $13,500 | $2,306 | $11,194 |
| 2014 | $3,597 | $13,500 | $2,306 | $11,194 |
| 2013 | $4,672 | $18,170 | $2,306 | $15,864 |
Source: Public Records
Map
Nearby Homes
- 7900 S Nagle Ave Unit 1S
- 7900 Nagle Ave Unit 3S
- 7728 Natchez Ave
- 7712 Nagle Ave
- 7943 Natoma Ave
- 8019 Natchez Ave
- 7721 Normandy Ave
- 7921 Mobile Ave
- 7858 Rutherford Ave Unit 3D
- 8001 Rutherford Ave
- 7707 Mobile Ave
- 7948 Merrimac Ave
- 6241 W 80th St
- 7734 Melvina Ave
- 8138 Mulligan Ave
- 7723 Melvina Ave
- 6437 W 82nd St
- 7912 New Castle Ave
- 7711 Melvina Ave
- 6127 W 79th Place
- 7838 Natchez Ave
- 7832 Natchez Ave
- 7840 Natchez Ave
- 7830 Natchez Ave
- 7826 Natchez Ave
- 7826 Natchez Ave
- 7825 Neenah Ave
- 7827 Neenah Ave
- 7821 Neenah Ave
- 7845 Neenah Ave
- 7845 Neenah Ave
- 6510 W 79th St
- 6500 W 79th St
- 7827 Neenah Ave
- 7819 Neenah Ave
- 7822 Natchez Ave
- 7822 Natchez Ave
- 7817 Neenah Ave
- 7831 Natchez Ave
- 7829 Natchez Ave