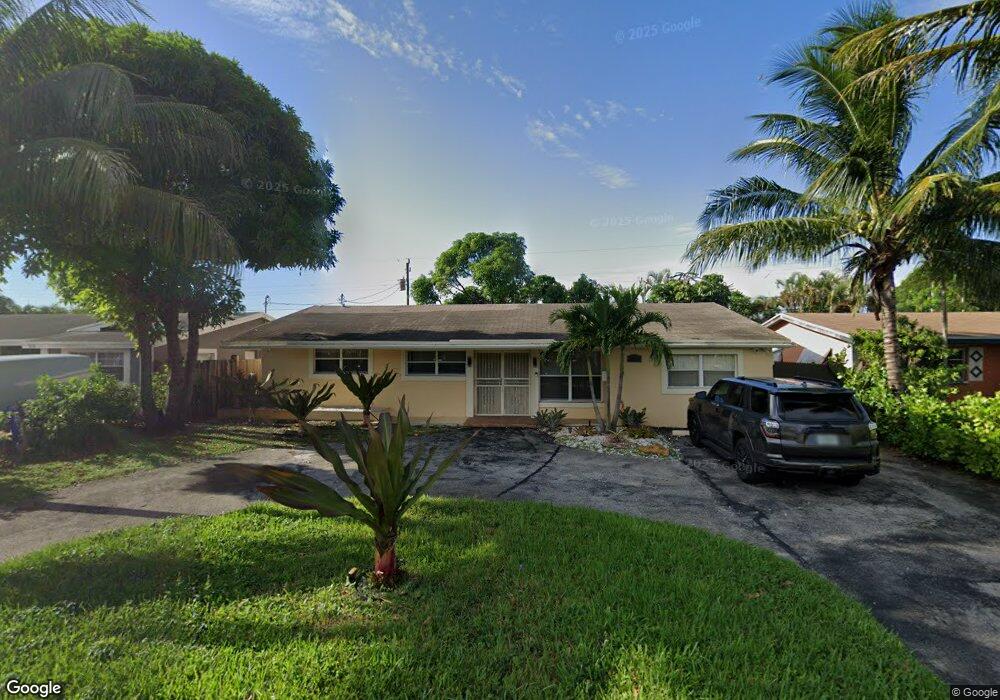
7836 Venetian St Miramar, FL 33023
Miramar Tropical NeighborhoodEstimated Value: $548,102 - $647,000
3
Beds
2
Baths
2,363
Sq Ft
$251/Sq Ft
Est. Value
About This Home
This home is located at 7836 Venetian St, Miramar, FL 33023 and is currently estimated at $592,026, approximately $250 per square foot. 7836 Venetian St is a home located in Broward County with nearby schools including Sunshine Elementary School, New Renaissance Middle School, and Miramar High School.
Ownership History
Date
Name
Owned For
Owner Type
Purchase Details
Closed on
Dec 16, 2005
Sold by
Rozier Elifete and Rozier Marie M
Bought by
Cantave Michaud and Lahens Marie
Current Estimated Value
Home Financials for this Owner
Home Financials are based on the most recent Mortgage that was taken out on this home.
Original Mortgage
$52,000
Outstanding Balance
$29,072
Interest Rate
6.18%
Mortgage Type
Stand Alone Second
Estimated Equity
$562,954
Purchase Details
Closed on
May 6, 2004
Sold by
Solomon Joseph and Solomon Yvonne
Bought by
Rozier Elifete and Rozier Marie M
Purchase Details
Closed on
Oct 7, 1999
Sold by
Francis Elizabeth
Bought by
Solomon Joseph and Solomon Yvonne
Purchase Details
Closed on
Jun 21, 1999
Sold by
Gayle Beverly
Bought by
Solomon Joseph
Purchase Details
Closed on
Apr 27, 1999
Sold by
Clerk Of The Court
Bought by
Wmfc 1997 4 Properties Inc
Create a Home Valuation Report for This Property
The Home Valuation Report is an in-depth analysis detailing your home's value as well as a comparison with similar homes in the area
Home Values in the Area
Average Home Value in this Area
Purchase History
| Date | Buyer | Sale Price | Title Company |
|---|---|---|---|
| Cantave Michaud | $260,000 | Land Star Title Inc | |
| Rozier Elifete | $183,000 | -- | |
| Solomon Joseph | $100,000 | -- | |
| Solomon Joseph | $5,500 | -- | |
| Wmfc 1997 4 Properties Inc | $100 | -- |
Source: Public Records
Mortgage History
| Date | Status | Borrower | Loan Amount |
|---|---|---|---|
| Open | Cantave Michaud | $52,000 | |
| Open | Cantave Michaud | $208,000 | |
| Previous Owner | Wmfc 1997 4 Properties Inc | $110,700 | |
| Previous Owner | Wmfc 1997 4 Properties Inc | $16,187 |
Source: Public Records
Tax History Compared to Growth
Tax History
| Year | Tax Paid | Tax Assessment Tax Assessment Total Assessment is a certain percentage of the fair market value that is determined by local assessors to be the total taxable value of land and additions on the property. | Land | Improvement |
|---|---|---|---|---|
| 2025 | $2,717 | $151,840 | -- | -- |
| 2024 | $2,649 | $147,570 | -- | -- |
| 2023 | $2,649 | $143,280 | $0 | $0 |
| 2022 | $2,430 | $139,110 | $0 | $0 |
| 2021 | $2,373 | $135,060 | $0 | $0 |
| 2020 | $2,343 | $133,200 | $0 | $0 |
| 2019 | $2,309 | $130,210 | $0 | $0 |
| 2018 | $2,209 | $127,790 | $0 | $0 |
| 2017 | $2,120 | $125,170 | $0 | $0 |
| 2016 | $2,107 | $122,600 | $0 | $0 |
| 2015 | $2,087 | $121,750 | $0 | $0 |
| 2014 | $2,039 | $120,790 | $0 | $0 |
| 2013 | -- | $121,280 | $30,000 | $91,280 |
Source: Public Records
Map
Nearby Homes
- 7952 Shalimar St
- 7740 Shalimar St
- 7969 Ramona St
- 7820 Orleans St
- 7655 Tropicana St
- 7642 Venetian St
- 7637 Tropicana St
- 2261 Utopia Dr
- 8051 SW 21st Ct Unit 8051
- 2110 Gulfstream Dr
- 2401 Largo Dr
- 8053 SW 21st Ct Unit 8053
- 7600 Venetian St
- 2270 Havana Dr
- 8109 SW 21st Ct Unit 8109
- 2273 SW 80th Terrace Unit 2273
- 8100 SW 21st Ct Unit 8100
- 2249 SW 80th Terrace Unit 2249
- 2431 Sabal Palm Dr
- 7612 Plantation Blvd
- 7840 Venetian St
- 7832 Venetian St
- 7837 Tropicana St
- 7833 Tropicana St
- 7841 Tropicana St
- 7828 Venetian St
- 7844 Venetian St
- 7837 Venetian St
- 7829 Tropicana St
- 7833 Venetian St
- 7841 Venetian St
- 7824 Venetian St
- 7829 Venetian St
- 7845 Venetian St
- 7825 Tropicana St
- 7900 Venetian St
- 7825 Venetian St
- 7852 Pembroke Rd Unit 7852
- 7852 Pembroke Rd
- 7820 Venetian St