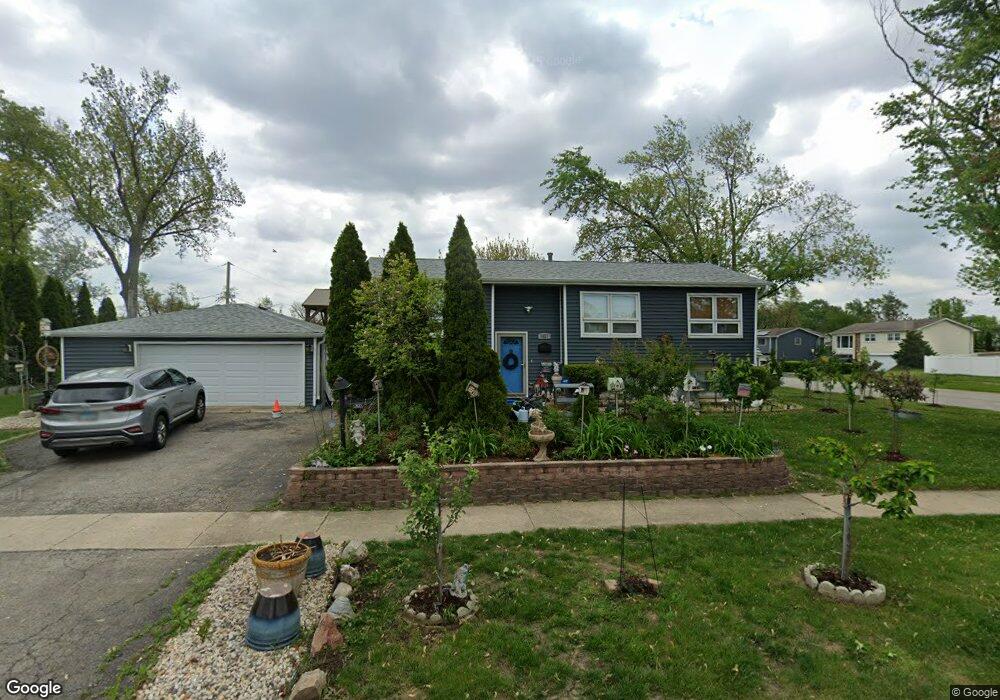
7837 Dalewood Pkwy Woodridge, IL 60517
West 83rd NeighborhoodEstimated Value: $324,000 - $403,000
--
Bed
1
Bath
1,199
Sq Ft
$304/Sq Ft
Est. Value
About This Home
This home is located at 7837 Dalewood Pkwy, Woodridge, IL 60517 and is currently estimated at $364,579, approximately $304 per square foot. 7837 Dalewood Pkwy is a home located in DuPage County with nearby schools including William F. Murphy Elementary School, Thomas Jefferson Junior High School, and Downers Grove South High School.
Ownership History
Date
Name
Owned For
Owner Type
Purchase Details
Closed on
Aug 8, 2012
Sold by
Liliya Lugovskoy Volodymyr and Liliya Luhovska
Bought by
Lugovskoy Volodymyr and Lugovskoy Liliya
Current Estimated Value
Home Financials for this Owner
Home Financials are based on the most recent Mortgage that was taken out on this home.
Original Mortgage
$193,000
Outstanding Balance
$134,952
Interest Rate
3.87%
Mortgage Type
New Conventional
Estimated Equity
$229,627
Purchase Details
Closed on
Aug 15, 2002
Sold by
Tate David L and Tate Sharon M
Bought by
Liliya Lugovskoy Volodymyr and Liliya Luhovska
Home Financials for this Owner
Home Financials are based on the most recent Mortgage that was taken out on this home.
Original Mortgage
$196,200
Interest Rate
6.63%
Purchase Details
Closed on
Mar 13, 2001
Sold by
Tate David L and Tate Sharon M
Bought by
Tate David L and Tate Sharon M
Create a Home Valuation Report for This Property
The Home Valuation Report is an in-depth analysis detailing your home's value as well as a comparison with similar homes in the area
Home Values in the Area
Average Home Value in this Area
Purchase History
| Date | Buyer | Sale Price | Title Company |
|---|---|---|---|
| Lugovskoy Volodymyr | -- | National Title Center Inc | |
| Liliya Lugovskoy Volodymyr | $218,000 | Premier Title | |
| Tate David L | -- | -- |
Source: Public Records
Mortgage History
| Date | Status | Borrower | Loan Amount |
|---|---|---|---|
| Open | Lugovskoy Volodymyr | $193,000 | |
| Closed | Liliya Lugovskoy Volodymyr | $196,200 |
Source: Public Records
Tax History Compared to Growth
Tax History
| Year | Tax Paid | Tax Assessment Tax Assessment Total Assessment is a certain percentage of the fair market value that is determined by local assessors to be the total taxable value of land and additions on the property. | Land | Improvement |
|---|---|---|---|---|
| 2024 | $8,691 | $114,698 | $55,322 | $59,376 |
| 2023 | $8,249 | $104,680 | $50,490 | $54,190 |
| 2022 | $8,101 | $100,660 | $48,550 | $52,110 |
| 2021 | $7,724 | $96,850 | $46,710 | $50,140 |
| 2020 | $7,610 | $94,570 | $45,870 | $48,700 |
| 2019 | $7,375 | $90,480 | $43,890 | $46,590 |
| 2018 | $6,971 | $83,040 | $40,280 | $42,760 |
| 2017 | $6,778 | $80,240 | $38,920 | $41,320 |
| 2016 | $6,655 | $77,340 | $37,510 | $39,830 |
| 2015 | $6,546 | $72,830 | $35,320 | $37,510 |
| 2014 | $6,483 | $70,210 | $34,050 | $36,160 |
| 2013 | $6,384 | $70,380 | $34,130 | $36,250 |
Source: Public Records
Map
Nearby Homes
- 7836 Catalpa Ave
- 2546 Jonquil Ln
- 2302 Dalewood Pkwy
- 8202 Piers Dr Unit 1302
- 2220 Wharf Dr Unit 1906
- 2212 Wharf Dr Unit 2102
- 2110 Country Club Dr Unit 197F
- 7664 Willow Ave
- 2732 Davos Ave
- 2033 Westbury Dr
- 7660 Walnut Ave
- 8040 Geneva St
- 2721 Zurich Ln
- 3 Oakview Ct
- 2824 Jonquil Ln
- 649 Sheffield Ln
- 8327 Chelsea Ln
- 1807 Nottingham Rd
- 2852 Everglade Ave
- Lot 006 Woodward Ave
- 2310 Birchwood Pkwy
- 7833 Dalewood Pkwy
- 7836 Valley View Ln
- 2322 Birchwood Pkwy
- 7829 Dalewood Pkwy
- 7832 Valley View Ln
- 7903 Apache Ln
- 7834 Dalewood Pkwy
- 2309 Birchwood Pkwy
- 7825 Dalewood Pkwy
- 7830 Dalewood Pkwy
- 7828 Valley View Ln
- 7902 Apache Ln
- Lot 35 Sycamore Ct
- 7909 Apache Ln
- 7826 Dalewood Pkwy
- 2305 Birchwood Pkwy
- 2330 Birchwood Pkwy
- 7822 Dalewood Pkwy
- 2234 Birchwood Pkwy