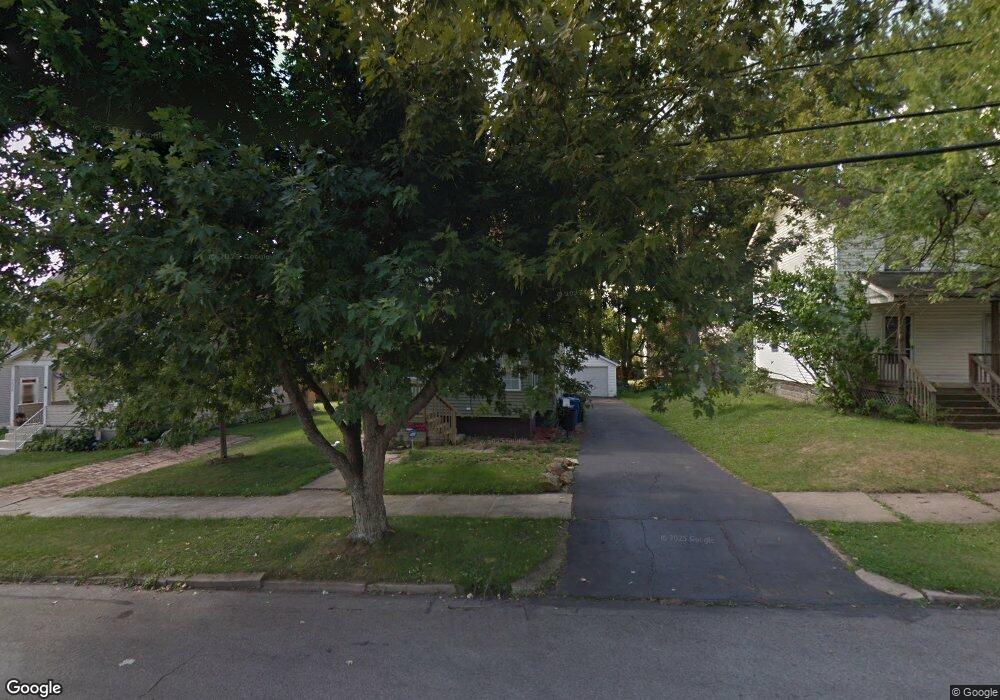
7838 3rd St Masury, OH 44438
Estimated Value: $83,000 - $95,271
3
Beds
1
Bath
1,040
Sq Ft
$87/Sq Ft
Est. Value
About This Home
This home is located at 7838 3rd St, Masury, OH 44438 and is currently estimated at $90,318, approximately $86 per square foot. 7838 3rd St is a home located in Trumbull County with nearby schools including Brookfield Elementary School, Brookfield Middle School, and Brookfield High School.
Ownership History
Date
Name
Owned For
Owner Type
Purchase Details
Closed on
Dec 11, 2020
Sold by
Gaut John R
Bought by
Lowe Keandre D
Current Estimated Value
Home Financials for this Owner
Home Financials are based on the most recent Mortgage that was taken out on this home.
Original Mortgage
$50,500
Outstanding Balance
$45,040
Interest Rate
2.8%
Mortgage Type
New Conventional
Estimated Equity
$45,278
Purchase Details
Closed on
Feb 26, 2008
Sold by
Nichols Melvin E and Isabelle Nichols M
Bought by
Gaut John R
Home Financials for this Owner
Home Financials are based on the most recent Mortgage that was taken out on this home.
Original Mortgage
$54,051
Interest Rate
5.9%
Mortgage Type
FHA
Purchase Details
Closed on
Jun 21, 1994
Sold by
Reiser Brian L
Bought by
Nichols Melvin E
Purchase Details
Closed on
Jan 1, 1990
Bought by
Brian L Reiser
Create a Home Valuation Report for This Property
The Home Valuation Report is an in-depth analysis detailing your home's value as well as a comparison with similar homes in the area
Purchase History
| Date | Buyer | Sale Price | Title Company |
|---|---|---|---|
| Lowe Keandre D | $59,000 | None Available | |
| Gaut John R | $54,900 | Attorney | |
| Nichols Melvin E | $27,000 | -- | |
| Brian L Reiser | -- | -- |
Source: Public Records
Mortgage History
| Date | Status | Borrower | Loan Amount |
|---|---|---|---|
| Open | Lowe Keandre D | $50,500 | |
| Previous Owner | Gaut John R | $54,051 |
Source: Public Records
Tax History
| Year | Tax Paid | Tax Assessment Tax Assessment Total Assessment is a certain percentage of the fair market value that is determined by local assessors to be the total taxable value of land and additions on the property. | Land | Improvement |
|---|---|---|---|---|
| 2024 | $949 | $20,060 | $2,100 | $17,960 |
| 2023 | $949 | $20,060 | $2,100 | $17,960 |
| 2022 | $1,096 | $15,790 | $2,100 | $13,690 |
| 2021 | $842 | $15,790 | $2,100 | $13,690 |
| 2020 | $836 | $15,790 | $2,100 | $13,690 |
| 2019 | $853 | $15,020 | $2,100 | $12,920 |
| 2018 | $846 | $15,020 | $2,100 | $12,920 |
| 2017 | $844 | $15,020 | $2,100 | $12,920 |
| 2016 | $874 | $14,950 | $2,100 | $12,850 |
| 2015 | $875 | $14,950 | $2,100 | $12,850 |
| 2014 | $871 | $14,950 | $2,100 | $12,850 |
| 2013 | $1,025 | $15,930 | $2,100 | $13,830 |
Source: Public Records
Map
Nearby Homes
- 7822 2nd St
- 1017 Broadway St
- 7931 Service St
- 7647 Connelly Rd
- 0 Addison Rd Unit 5181382
- 917 S Irvine Ave
- 780 S Irvine Ave
- 766 S Irvine Ave
- 676 S State Line Rd
- 672 S Stateline Rd
- 1952 Hubbard Masury Rd
- 453 Lafayette Ave
- 7304 Oakwood Dr Unit 9
- 306 Federal St
- 7058 Pine Grove Dr
- 506 Spearman Ave
- 249 S Irvine Ave
- 7954 Warren - Sharon Rd
- 522 Wallis Ave
- 331 A St
Your Personal Tour Guide
Ask me questions while you tour the home.