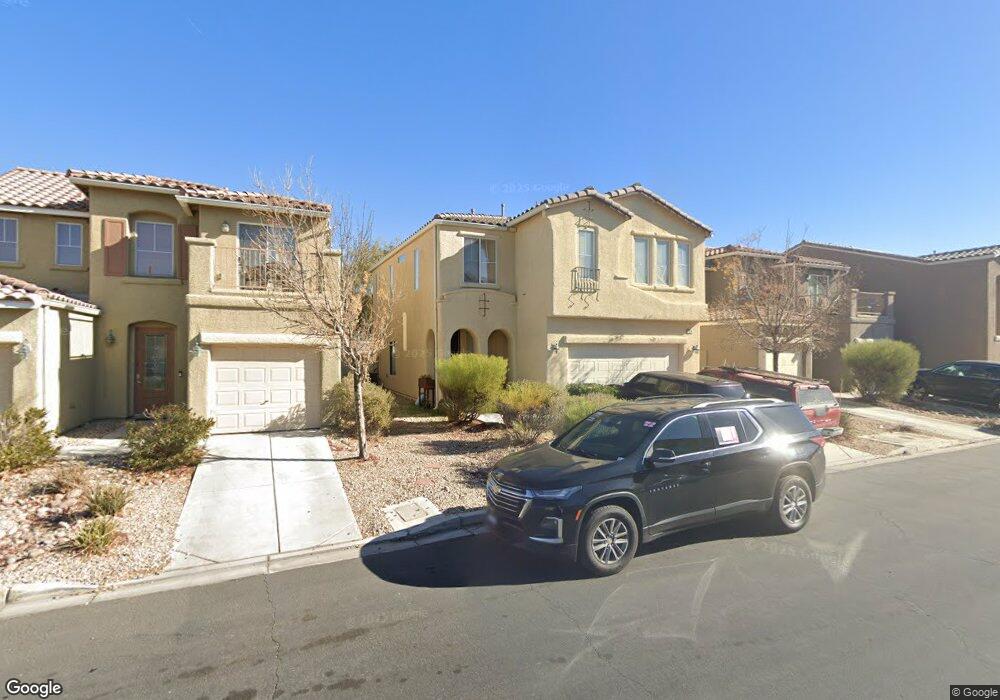
7838 Soda Canyon St Las Vegas, NV 89139
Coronado Ranch NeighborhoodEstimated Value: $427,000 - $449,000
3
Beds
3
Baths
1,846
Sq Ft
$235/Sq Ft
Est. Value
About This Home
This home is located at 7838 Soda Canyon St, Las Vegas, NV 89139 and is currently estimated at $433,716, approximately $234 per square foot. 7838 Soda Canyon St is a home located in Clark County with nearby schools including Mark L Fine Elementary School, Lawrence & Heidi Canarelli Middle School, and Desert Oasis High School.
Ownership History
Date
Name
Owned For
Owner Type
Purchase Details
Closed on
Apr 15, 2008
Sold by
Citimortgage Inc
Bought by
Lam Julian H
Current Estimated Value
Home Financials for this Owner
Home Financials are based on the most recent Mortgage that was taken out on this home.
Original Mortgage
$159,000
Outstanding Balance
$100,825
Interest Rate
5.99%
Mortgage Type
Unknown
Estimated Equity
$332,891
Purchase Details
Closed on
Jan 16, 2008
Sold by
Payabyab Brian
Bought by
Citimortgage Inc
Purchase Details
Closed on
Jun 9, 2006
Sold by
Richmond American Homes Of Nevada Inc
Bought by
Payabyab Brian
Home Financials for this Owner
Home Financials are based on the most recent Mortgage that was taken out on this home.
Original Mortgage
$260,000
Interest Rate
7.5%
Mortgage Type
Fannie Mae Freddie Mac
Create a Home Valuation Report for This Property
The Home Valuation Report is an in-depth analysis detailing your home's value as well as a comparison with similar homes in the area
Home Values in the Area
Average Home Value in this Area
Purchase History
| Date | Buyer | Sale Price | Title Company |
|---|---|---|---|
| Lam Julian H | $198,888 | Fidelity National Title | |
| Citimortgage Inc | $279,615 | First American Title Company | |
| Payabyab Brian | $325,001 | Ticor Title Of Nevada Inc |
Source: Public Records
Mortgage History
| Date | Status | Borrower | Loan Amount |
|---|---|---|---|
| Open | Lam Julian H | $159,000 | |
| Previous Owner | Payabyab Brian | $260,000 |
Source: Public Records
Tax History Compared to Growth
Tax History
| Year | Tax Paid | Tax Assessment Tax Assessment Total Assessment is a certain percentage of the fair market value that is determined by local assessors to be the total taxable value of land and additions on the property. | Land | Improvement |
|---|---|---|---|---|
| 2025 | $1,783 | $112,007 | $33,250 | $78,757 |
| 2024 | $1,731 | $112,007 | $33,250 | $78,757 |
| 2023 | $1,731 | $105,586 | $31,500 | $74,086 |
| 2022 | $1,681 | $93,165 | $25,550 | $67,615 |
| 2021 | $1,632 | $88,632 | $24,500 | $64,132 |
| 2020 | $1,582 | $87,983 | $24,500 | $63,483 |
| 2019 | $1,536 | $82,297 | $19,950 | $62,347 |
| 2018 | $1,491 | $76,693 | $17,150 | $59,543 |
| 2017 | $2,062 | $70,315 | $14,350 | $55,965 |
| 2016 | $1,413 | $63,292 | $12,250 | $51,042 |
| 2015 | $1,409 | $49,861 | $8,750 | $41,111 |
| 2014 | $1,365 | $45,162 | $5,950 | $39,212 |
Source: Public Records
Map
Nearby Homes
- 7825 Bright Lodge St
- 5597 Fewkes Canyon Ct
- 7881 Tyrell Peaks St
- 7828 Bright Lodge St
- 5384 Knitmore Ct
- 7813 Westwind Rd
- 5359 Montauck Ave
- 7766 Pacific Dunes St
- 5688 Woodchester Ave
- 5709 Woodchester Ave
- 7826 Harp Tree St
- 5419 Floating Flower Ave
- 7597 Aspen Color St
- 7633 Magic Cove Ct Unit 1
- 5481 Railroad River Ave
- 7569 Garden Galley St
- 7884 Millbrookshire Way
- 7689 Black River St
- 5986 Ambleshire Ave
- 7576 Jacaranda Leaf St
- 7844 Soda Canyon St
- 7832 Soda Canyon St
- 7850 Soda Canyon St
- 7826 Soda Canyon St
- 5548 Fewkes Canyon Ct
- 7856 Soda Canyon St
- 7820 Soda Canyon St
- 7820 Soda Canyon St Unit n/a
- 5543 Chapin Mesa Ave
- 5558 Fewkes Canyon Ct
- 5553 Chapin Mesa Ave
- 7862 Soda Canyon St
- 7814 Soda Canyon St
- 7835 Tyrell Peaks St
- 7841 Tyrell Peaks St
- 7829 Tyrell Peaks St
- 5547 Fewkes Canyon Ct
- 5568 Fewkes Canyon Ct
- 7847 Tyrell Peaks St
- 7823 Tyrell Peaks St