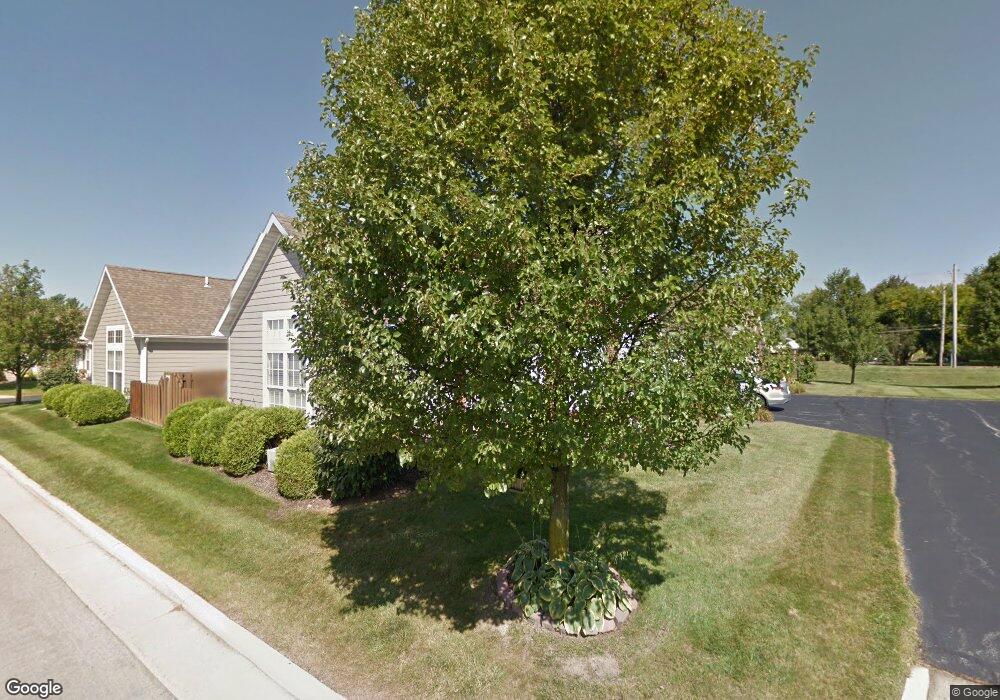
7838 Timbers Edge Waterville, OH 43566
Estimated Value: $242,619 - $258,000
2
Beds
2
Baths
1,250
Sq Ft
$201/Sq Ft
Est. Value
About This Home
This home is located at 7838 Timbers Edge, Waterville, OH 43566 and is currently estimated at $250,905, approximately $200 per square foot. 7838 Timbers Edge is a home located in Lucas County with nearby schools including Anthony Wayne High School, Lial Catholic School, and Monclova Christian Academy.
Ownership History
Date
Name
Owned For
Owner Type
Purchase Details
Closed on
Jun 29, 2017
Sold by
Emnett Charles W
Bought by
Bachman Sandra
Current Estimated Value
Purchase Details
Closed on
Feb 5, 2017
Sold by
Emnett Joan Ne
Bought by
Bachman Sandr and Bachman Charles W
Purchase Details
Closed on
Oct 25, 2007
Sold by
Schwartz Robert D and Schwartz Kathy A
Bought by
Emnett Joanne
Purchase Details
Closed on
Feb 16, 2007
Sold by
Schwartz Robert D and Schwartz Kathy A
Bought by
Schwartz Robert D and Schwartz Kathy A
Purchase Details
Closed on
Aug 27, 2002
Sold by
Fallen Timbers Fairways Ltd
Bought by
Schwartz Robert D and Schwartz Kathy A
Home Financials for this Owner
Home Financials are based on the most recent Mortgage that was taken out on this home.
Original Mortgage
$100,000
Interest Rate
6.54%
Mortgage Type
Balloon
Create a Home Valuation Report for This Property
The Home Valuation Report is an in-depth analysis detailing your home's value as well as a comparison with similar homes in the area
Home Values in the Area
Average Home Value in this Area
Purchase History
| Date | Buyer | Sale Price | Title Company |
|---|---|---|---|
| Bachman Sandra | -- | None Available | |
| Bachman Sandr | $125,000 | None Available | |
| Emnett Joanne | $138,500 | Attorney | |
| Schwartz Robert D | -- | Attorney | |
| Schwartz Robert D | $136,300 | Midland |
Source: Public Records
Mortgage History
| Date | Status | Borrower | Loan Amount |
|---|---|---|---|
| Previous Owner | Schwartz Robert D | $100,000 |
Source: Public Records
Tax History Compared to Growth
Tax History
| Year | Tax Paid | Tax Assessment Tax Assessment Total Assessment is a certain percentage of the fair market value that is determined by local assessors to be the total taxable value of land and additions on the property. | Land | Improvement |
|---|---|---|---|---|
| 2024 | $1,669 | $73,290 | $2,170 | $71,120 |
| 2023 | $2,406 | $49,315 | $1,680 | $47,635 |
| 2022 | $2,430 | $49,315 | $1,680 | $47,635 |
| 2021 | $2,332 | $49,315 | $1,680 | $47,635 |
| 2020 | $2,355 | $44,695 | $5,110 | $39,585 |
| 2019 | $2,300 | $44,695 | $5,110 | $39,585 |
| 2018 | $2,233 | $44,695 | $5,110 | $39,585 |
| 2017 | $2,293 | $43,575 | $4,900 | $38,675 |
| 2016 | $2,271 | $124,500 | $14,000 | $110,500 |
| 2015 | $2,176 | $124,500 | $14,000 | $110,500 |
| 2014 | $2,099 | $42,710 | $4,800 | $37,910 |
| 2013 | $2,099 | $42,710 | $4,800 | $37,910 |
Source: Public Records
Map
Nearby Homes
- 8025 Stitt Rd
- 7538 Tournament Dr
- 8251 Stitt Rd
- 5731 Hamptons Dr
- 5801 Hamptons Dr
- 5218 Black Rd
- 5160 Black Rd
- 5002 Black Rd
- 1355 Roberts Cir
- 7909 Trestle Bend Rd
- 7901 Trestle Bend Rd
- 8342 Kacie Ln
- 8470 Alyssa Way
- 7844 Iron Horse Rd
- 5120 Lake Breeze Ln
- 7764 N Woodbridge Rd
- 7939 N Woodbridge Rd
- 4902 Buckeye Dr
- 7618 Peppergrass Crossing
- 8453 Misty Gorge Rd
- 7842 Timbers Edge
- 7827 Timbers Edge
- 7853 Timbers Edge
- 7834 Timbers Edge
- 7846 Timbers Edge
- 7846 Timbers Edge Unit 9-7846
- 7846 Timbers Edge Unit 19-7846
- 7826 Timbers Edge
- 7830 Timbers Edge
- 7830 Timbers Edge Unit 18-7830
- 7822 Timbers Edge
- 7854 Timbers Edge
- 5745 Crossbrooke Ln
- 5745 Crossbrooke Ln Unit 5745
- 7831 Timbers Edge
- 7831 Timbers Edge Unit 31-783
- 7825 Timbers Edge
- 7825 Timbers Edge Unit 1-7825
- 7825 Timbers Edge Unit 31-782
- 7818 Timbers Edge