Estimated Value: $108,828 - $276,000
4
Beds
1
Bath
1,764
Sq Ft
$107/Sq Ft
Est. Value
About This Home
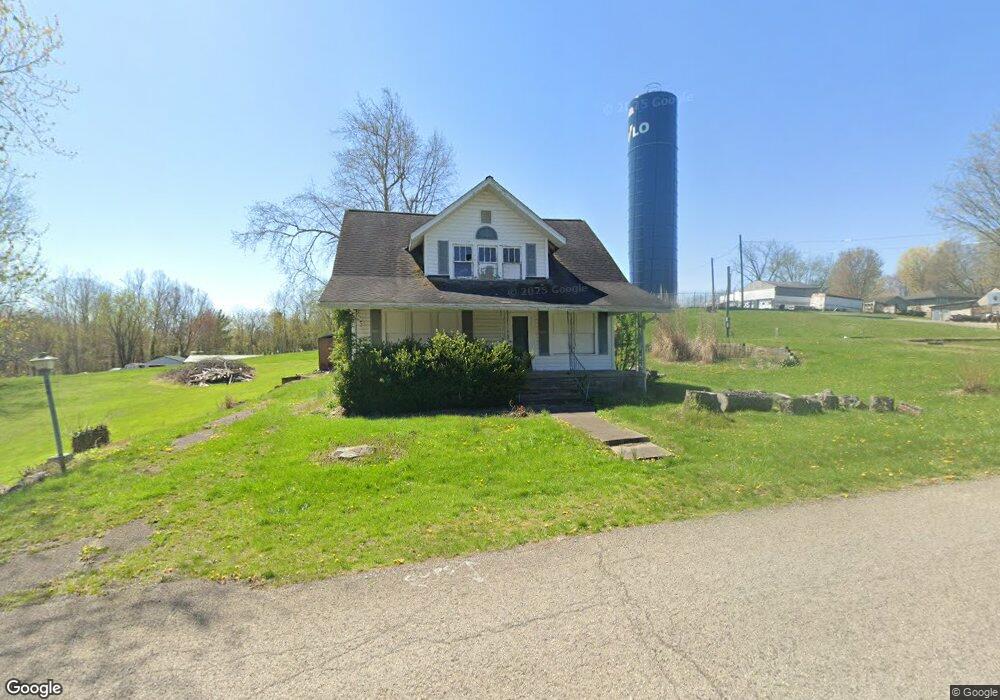
This home is located at 784 3rd St, Philo, OH 43771 and is currently estimated at $188,457, approximately $106 per square foot. 784 3rd St is a home located in Muskingum County with nearby schools including Philo High School.
Ownership History
Date
Name
Owned For
Owner Type
Purchase Details
Closed on
Oct 27, 2008
Sold by
Cartwright Cameron W
Bought by
94 Main Llc
Current Estimated Value
Home Financials for this Owner
Home Financials are based on the most recent Mortgage that was taken out on this home.
Original Mortgage
$40,503
Interest Rate
5.73%
Mortgage Type
Purchase Money Mortgage
Purchase Details
Closed on
Oct 2, 2008
Sold by
Hsbc Bank Usa
Bought by
Cartwright Cameron W
Home Financials for this Owner
Home Financials are based on the most recent Mortgage that was taken out on this home.
Original Mortgage
$40,503
Interest Rate
5.73%
Mortgage Type
Purchase Money Mortgage
Purchase Details
Closed on
May 16, 2008
Sold by
Evans Frederick L and Evans Fredrick L
Bought by
Hsbc Bank Usa
Purchase Details
Closed on
Sep 7, 1999
Sold by
Est Imogene B Duvall
Bought by
St Clair Timothy R
Home Financials for this Owner
Home Financials are based on the most recent Mortgage that was taken out on this home.
Original Mortgage
$39,800
Interest Rate
7.25%
Mortgage Type
New Conventional
Create a Home Valuation Report for This Property
The Home Valuation Report is an in-depth analysis detailing your home's value as well as a comparison with similar homes in the area
Purchase History
| Date | Buyer | Sale Price | Title Company |
|---|---|---|---|
| 94 Main Llc | -- | Attorney | |
| Cartwright Cameron W | $40,333 | Accutitle Agency Inc | |
| Hsbc Bank Usa | $30,000 | None Available | |
| St Clair Timothy R | $46,000 | -- |
Source: Public Records
Mortgage History
| Date | Status | Borrower | Loan Amount |
|---|---|---|---|
| Previous Owner | Cartwright Cameron W | $40,503 | |
| Previous Owner | St Clair Timothy R | $39,800 |
Source: Public Records
Tax History
| Year | Tax Paid | Tax Assessment Tax Assessment Total Assessment is a certain percentage of the fair market value that is determined by local assessors to be the total taxable value of land and additions on the property. | Land | Improvement |
|---|---|---|---|---|
| 2025 | $512 | $7,420 | $2,135 | $5,285 |
| 2024 | $275 | $7,420 | $2,135 | $5,285 |
| 2023 | $642 | $9,450 | $1,085 | $8,365 |
| 2022 | $369 | $9,450 | $1,085 | $8,365 |
| 2021 | $364 | $9,450 | $1,085 | $8,365 |
| 2020 | $316 | $7,875 | $910 | $6,965 |
| 2019 | $315 | $7,875 | $910 | $6,965 |
| 2018 | $380 | $7,875 | $910 | $6,965 |
| 2017 | $394 | $8,785 | $910 | $7,875 |
| 2016 | $432 | $9,730 | $910 | $8,820 |
| 2015 | $439 | $9,730 | $910 | $8,820 |
| 2013 | $415 | $9,730 | $910 | $8,820 |
Source: Public Records
Map
Nearby Homes
- 307 Harris St
- 960 3rd St
- 134 Main St
- 252 Front St
- 385 Water St
- 243 Mill St
- 512 North St
- 4145 Old River Rd
- 0 Sealover Hollow Rd
- 0 Durant Rd Unit 5186947
- 3100 Durant Rd
- 1685 Fattler Ridge Rd
- 3345 Durant Rd
- 8285 Old River Rd
- 2630 Wilhelm Rd
- 965 Back Run Rd
- 3010 S River Rd
- 2630 Glenn Cir
- 2519 Frick Dr
- 3900 Chandlersville Rd
Your Personal Tour Guide
Ask me questions while you tour the home.