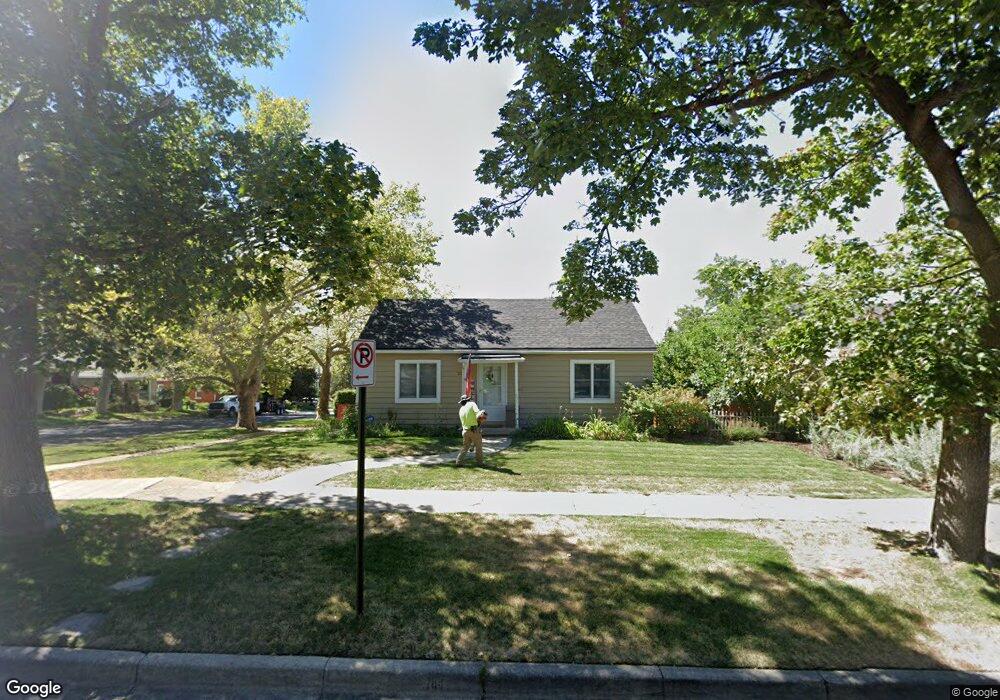
784 6th Ave Salt Lake City, UT 84103
The Avenues NeighborhoodEstimated Value: $592,000 - $623,000
2
Beds
1
Bath
888
Sq Ft
$686/Sq Ft
Est. Value
About This Home
This home is located at 784 6th Ave, Salt Lake City, UT 84103 and is currently estimated at $609,166, approximately $685 per square foot. 784 6th Ave is a home located in Salt Lake County with nearby schools including Ensign School, West High, and Open Classroom.
Ownership History
Date
Name
Owned For
Owner Type
Purchase Details
Closed on
Jun 2, 2016
Sold by
Johnson Debra
Bought by
Dry Robert A
Current Estimated Value
Home Financials for this Owner
Home Financials are based on the most recent Mortgage that was taken out on this home.
Original Mortgage
$283,500
Outstanding Balance
$225,928
Interest Rate
3.61%
Mortgage Type
New Conventional
Estimated Equity
$383,238
Purchase Details
Closed on
Sep 19, 2002
Sold by
Johnson Debbie S
Bought by
Johnson Debra
Home Financials for this Owner
Home Financials are based on the most recent Mortgage that was taken out on this home.
Original Mortgage
$155,400
Interest Rate
6.24%
Purchase Details
Closed on
Jun 7, 2000
Sold by
Zwierzycki Raymond N
Bought by
Johnson Debbie S
Home Financials for this Owner
Home Financials are based on the most recent Mortgage that was taken out on this home.
Original Mortgage
$146,400
Interest Rate
8.15%
Create a Home Valuation Report for This Property
The Home Valuation Report is an in-depth analysis detailing your home's value as well as a comparison with similar homes in the area
Home Values in the Area
Average Home Value in this Area
Purchase History
| Date | Buyer | Sale Price | Title Company |
|---|---|---|---|
| Dry Robert A | -- | Metro National Title | |
| Johnson Debra | -- | Surety Title | |
| Johnson Debbie S | -- | Metro National Title |
Source: Public Records
Mortgage History
| Date | Status | Borrower | Loan Amount |
|---|---|---|---|
| Open | Dry Robert A | $283,500 | |
| Previous Owner | Johnson Debra | $155,400 | |
| Previous Owner | Johnson Debbie S | $146,400 |
Source: Public Records
Tax History Compared to Growth
Tax History
| Year | Tax Paid | Tax Assessment Tax Assessment Total Assessment is a certain percentage of the fair market value that is determined by local assessors to be the total taxable value of land and additions on the property. | Land | Improvement |
|---|---|---|---|---|
| 2025 | $2,283 | $513,300 | $298,000 | $215,300 |
| 2024 | $2,283 | $435,600 | $284,400 | $151,200 |
| 2023 | $2,299 | $422,800 | $273,500 | $149,300 |
| 2022 | $2,563 | $442,200 | $268,100 | $174,100 |
| 2021 | $2,222 | $347,100 | $217,800 | $129,300 |
| 2020 | $2,198 | $326,900 | $203,600 | $123,300 |
| 2019 | $1,872 | $261,900 | $194,300 | $67,600 |
| 2018 | $1,726 | $235,200 | $194,300 | $40,900 |
| 2017 | $1,736 | $221,600 | $194,300 | $27,300 |
| 2016 | $1,968 | $238,500 | $178,700 | $59,800 |
| 2015 | $1,992 | $228,800 | $99,700 | $129,100 |
| 2014 | $1,879 | $214,100 | $105,000 | $109,100 |
Source: Public Records
Map
Nearby Homes