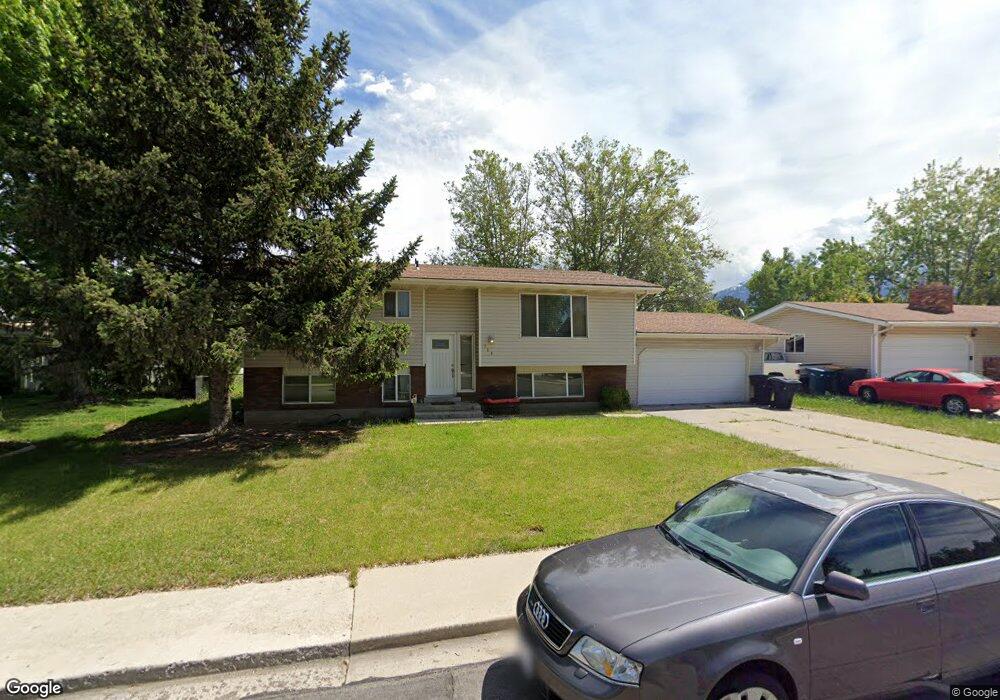
784 Crest Dr Orem, UT 84057
Bonneville NeighborhoodEstimated Value: $489,000 - $565,000
5
Beds
2
Baths
2,188
Sq Ft
$241/Sq Ft
Est. Value
About This Home
This home is located at 784 Crest Dr, Orem, UT 84057 and is currently estimated at $526,228, approximately $240 per square foot. 784 Crest Dr is a home located in Utah County with nearby schools including Bonneville Elementary School, Orem Junior High School, and Timpanogos High School.
Ownership History
Date
Name
Owned For
Owner Type
Purchase Details
Closed on
Jul 3, 2006
Sold by
Mcchesney Kathryn M
Bought by
Mcchesney Mike and Mcchesney Kathryn
Current Estimated Value
Home Financials for this Owner
Home Financials are based on the most recent Mortgage that was taken out on this home.
Original Mortgage
$149,150
Outstanding Balance
$98,340
Interest Rate
8.75%
Mortgage Type
New Conventional
Estimated Equity
$427,888
Purchase Details
Closed on
Oct 1, 2003
Sold by
Williams Gary A and Williams Jacqueline A
Bought by
Mcchesney Kathryn M
Purchase Details
Closed on
Feb 12, 1999
Sold by
Brown Jeremy A and Brown Cynthia
Bought by
Williams Gary A and Williams Jacqueline A
Home Financials for this Owner
Home Financials are based on the most recent Mortgage that was taken out on this home.
Original Mortgage
$133,750
Interest Rate
6.77%
Create a Home Valuation Report for This Property
The Home Valuation Report is an in-depth analysis detailing your home's value as well as a comparison with similar homes in the area
Home Values in the Area
Average Home Value in this Area
Purchase History
| Date | Buyer | Sale Price | Title Company |
|---|---|---|---|
| Mcchesney Mike | -- | Title One | |
| Mcchesney Mike | -- | Title One | |
| Mcchesney Kathryn M | -- | Horizon Title | |
| Williams Gary A | -- | Inwest Title Services Inc |
Source: Public Records
Mortgage History
| Date | Status | Borrower | Loan Amount |
|---|---|---|---|
| Open | Mcchesney Mike | $149,150 | |
| Closed | Mcchesney Mike | $149,150 | |
| Previous Owner | Williams Gary A | $133,750 |
Source: Public Records
Tax History
| Year | Tax Paid | Tax Assessment Tax Assessment Total Assessment is a certain percentage of the fair market value that is determined by local assessors to be the total taxable value of land and additions on the property. | Land | Improvement |
|---|---|---|---|---|
| 2025 | $1,964 | $256,850 | -- | -- |
| 2024 | $1,964 | $240,185 | $0 | $0 |
| 2023 | $1,840 | $241,780 | $0 | $0 |
| 2022 | $1,792 | $228,140 | $0 | $0 |
| 2021 | $1,668 | $321,700 | $154,100 | $167,600 |
| 2020 | $1,517 | $287,600 | $123,300 | $164,300 |
| 2019 | $1,393 | $274,600 | $123,300 | $151,300 |
| 2018 | $1,311 | $246,900 | $112,700 | $134,200 |
| 2017 | $1,261 | $127,215 | $0 | $0 |
| 2016 | $1,259 | $117,150 | $0 | $0 |
| 2015 | $1,184 | $104,170 | $0 | $0 |
| 2014 | $1,128 | $98,780 | $0 | $0 |
Source: Public Records
Map
Nearby Homes
- 1405 N 770 W
- 582 W 1300 N
- 1123 N 800 W
- 545 W 1240 N
- 531 W 1350 N
- 538 W 1120 N
- 999 W 1100 N
- 1535 N 950 W
- 1545 N State St Unit 1
- 1086 N 1005 W
- 1062 N 1035 W
- 967 W 1630 N
- 1461 N Amiron Way Unit D
- 1461 N Amiron Way Unit B
- 930 N 980 W
- 332 W Amiron Way Unit D
- 1004 N 1090 W Unit 203
- 1167 W 1550 N
- 1069 N 1160 W
- 651 W 1800 N
Your Personal Tour Guide
Ask me questions while you tour the home.