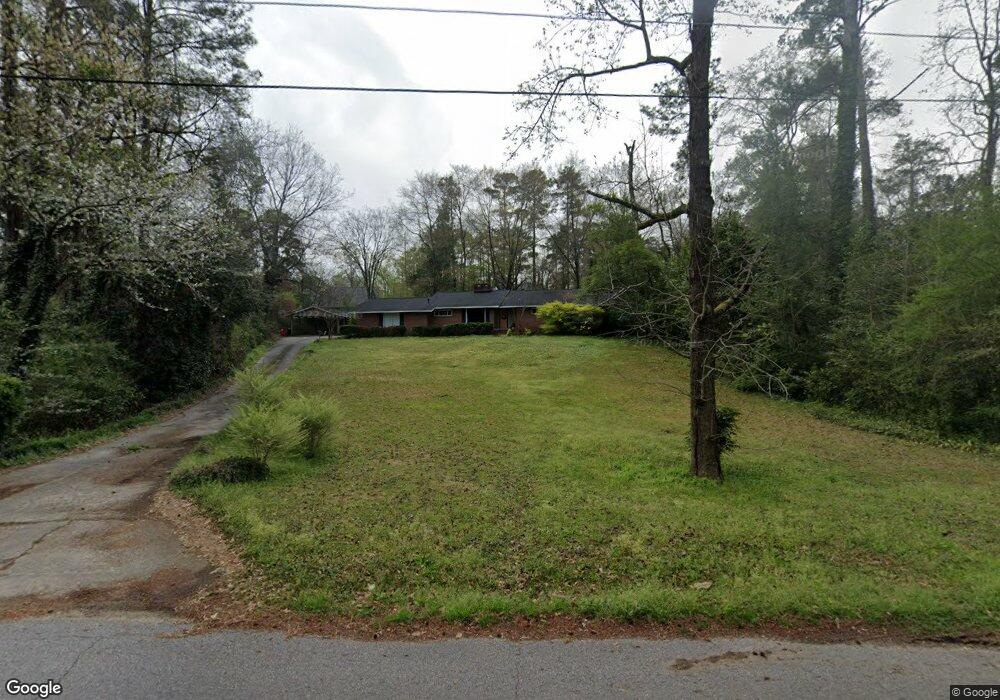
784 Marshall Dr Macon, GA 31210
Estimated Value: $203,249 - $247,000
3
Beds
2
Baths
1,977
Sq Ft
$111/Sq Ft
Est. Value
About This Home
This home is located at 784 Marshall Dr, Macon, GA 31210 and is currently estimated at $218,562, approximately $110 per square foot. 784 Marshall Dr is a home located in Bibb County with nearby schools including Lane Elementary School, Howard Middle School, and Howard High School.
Ownership History
Date
Name
Owned For
Owner Type
Purchase Details
Closed on
May 18, 2018
Sold by
Jolley Floyd A and Walker Mike
Bought by
Kidd Alexandra J
Current Estimated Value
Home Financials for this Owner
Home Financials are based on the most recent Mortgage that was taken out on this home.
Original Mortgage
$135,703
Outstanding Balance
$116,594
Interest Rate
4.4%
Mortgage Type
New Conventional
Estimated Equity
$101,968
Purchase Details
Closed on
Dec 10, 2011
Sold by
Jolley Floyd A
Bought by
Jolley Floyd A and Walker Mike
Home Financials for this Owner
Home Financials are based on the most recent Mortgage that was taken out on this home.
Original Mortgage
$87,230
Interest Rate
3.8%
Mortgage Type
FHA
Purchase Details
Closed on
Dec 8, 2011
Sold by
Wallace Dave E
Bought by
Jolley Floyd A
Home Financials for this Owner
Home Financials are based on the most recent Mortgage that was taken out on this home.
Original Mortgage
$87,230
Interest Rate
3.8%
Mortgage Type
FHA
Create a Home Valuation Report for This Property
The Home Valuation Report is an in-depth analysis detailing your home's value as well as a comparison with similar homes in the area
Purchase History
| Date | Buyer | Sale Price | Title Company |
|---|---|---|---|
| Kidd Alexandra J | $139,900 | None Available | |
| Jolley Floyd A | -- | None Available | |
| Jolley Floyd A | $89,500 | None Available |
Source: Public Records
Mortgage History
| Date | Status | Borrower | Loan Amount |
|---|---|---|---|
| Open | Kidd Alexandra J | $135,703 | |
| Previous Owner | Jolley Floyd A | $87,230 |
Source: Public Records
Tax History
| Year | Tax Paid | Tax Assessment Tax Assessment Total Assessment is a certain percentage of the fair market value that is determined by local assessors to be the total taxable value of land and additions on the property. | Land | Improvement |
|---|---|---|---|---|
| 2025 | $1,703 | $69,320 | $18,980 | $50,340 |
| 2024 | $1,729 | $68,076 | $18,980 | $49,096 |
| 2023 | $1,571 | $61,858 | $18,980 | $42,878 |
| 2022 | $2,021 | $58,376 | $8,878 | $49,498 |
| 2021 | $2,047 | $53,873 | $8,523 | $45,350 |
| 2020 | $2,009 | $51,740 | $8,168 | $43,572 |
| 2019 | $1,722 | $43,978 | $7,813 | $36,165 |
| 2018 | $2,670 | $41,537 | $7,813 | $33,724 |
| 2017 | $1,484 | $39,609 | $7,813 | $31,796 |
| 2016 | $1,370 | $39,609 | $7,813 | $31,796 |
| 2015 | $1,945 | $39,711 | $7,813 | $31,898 |
| 2014 | $2,277 | $40,421 | $8,523 | $31,898 |
Source: Public Records
Map
Nearby Homes
- 125 N Laura Ann Ct
- 610 Chastain Place
- 603 Willow Creek Dr
- 835 Old Lundy Rd
- 615 Willow Creek Dr
- 654 Willow Creek Dr
- 518 High Point North Rd
- 726 Willow Creek Dr
- 840 Balim Ct
- 810 Willow Creek Dr Unit 810
- 122 Lundy Ct
- 636 Lokchapee Ridge
- 770 Windsor Rd
- 623 Walton Way
- 790 Wimbish Rd
- 231 Alexandria Dr
- 1024 Normandy Rd
- 673 Commanche Dr
- 778 Marshall Dr
- 792 Marshall Dr
- 792 Marshall Dr Unit D17A
- 678 Chastain Place
- 661 Old Lundy Rd
- 772 Marshall Dr
- 665 Old Lundy Rd
- 781 Marshall Dr
- 798 Marshall Dr
- 777 Marshall Dr
- 641 Old Lundy Rd
- 675 Chastain Place
- 766 Marshall Dr
- 771 Marshall Dr
- 629 Old Lundy Rd
- 672 Old Lundy Rd
- 669 Chastain Place
- 791 Marshall Dr
- 670 Chastain Place
- 762 Marshall Dr
Your Personal Tour Guide
Ask me questions while you tour the home.