Estimated Value: $297,000 - $324,000
4
Beds
3
Baths
2,371
Sq Ft
$134/Sq Ft
Est. Value
About This Home
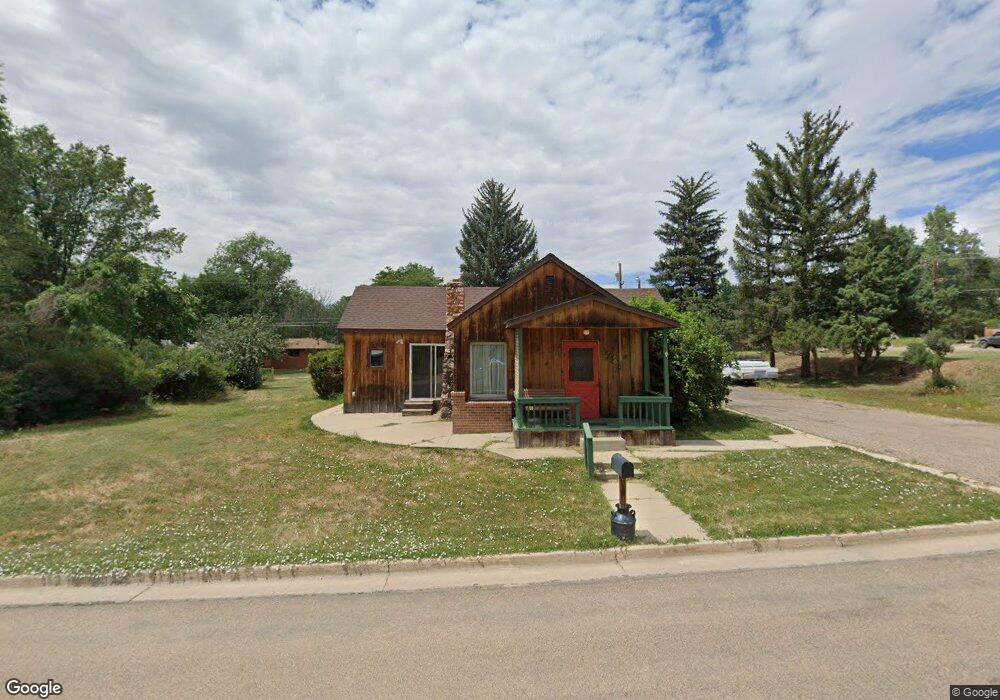
This home is located at 784 Ranney St, Craig, CO 81625 and is currently estimated at $316,725, approximately $133 per square foot. 784 Ranney St is a home located in Moffat County with nearby schools including Sunset Elementary School, Moffat County High School, and Calvary Baptist School.
Ownership History
Date
Name
Owned For
Owner Type
Purchase Details
Closed on
Nov 8, 2013
Sold by
Lorio Christopher S
Bought by
Lorio Christopher S and Lorio Heather D
Current Estimated Value
Home Financials for this Owner
Home Financials are based on the most recent Mortgage that was taken out on this home.
Original Mortgage
$267,130
Outstanding Balance
$203,131
Interest Rate
5.12%
Mortgage Type
FHA
Estimated Equity
$113,594
Purchase Details
Closed on
Sep 2, 2009
Sold by
David John E and David Marissa
Bought by
Lorio Christopher S
Home Financials for this Owner
Home Financials are based on the most recent Mortgage that was taken out on this home.
Original Mortgage
$192,054
Interest Rate
5.2%
Mortgage Type
FHA
Purchase Details
Closed on
Feb 25, 2005
Sold by
Seely Bruce H and Brennise Kathleen Seely
Bought by
David John E and David Marissa
Home Financials for this Owner
Home Financials are based on the most recent Mortgage that was taken out on this home.
Original Mortgage
$162,450
Interest Rate
5.71%
Mortgage Type
FHA
Create a Home Valuation Report for This Property
The Home Valuation Report is an in-depth analysis detailing your home's value as well as a comparison with similar homes in the area
Purchase History
| Date | Buyer | Sale Price | Title Company |
|---|---|---|---|
| Lorio Christopher S | -- | None Available | |
| Lorio Christopher S | $195,597 | None Available | |
| David John E | $82,500 | None Available | |
| David John E | $82,500 | None Available |
Source: Public Records
Mortgage History
| Date | Status | Borrower | Loan Amount |
|---|---|---|---|
| Open | Lorio Christopher S | $267,130 | |
| Closed | Lorio Christopher S | $192,054 | |
| Previous Owner | David John E | $162,450 |
Source: Public Records
Tax History
| Year | Tax Paid | Tax Assessment Tax Assessment Total Assessment is a certain percentage of the fair market value that is determined by local assessors to be the total taxable value of land and additions on the property. | Land | Improvement |
|---|---|---|---|---|
| 2025 | $1,516 | $16,511 | $0 | $0 |
| 2024 | $1,516 | $11,460 | $0 | $0 |
| 2023 | $994 | $11,460 | $3,160 | $8,300 |
| 2022 | $1,071 | $12,700 | $4,330 | $8,370 |
| 2021 | $1,082 | $13,070 | $4,460 | $8,610 |
| 2020 | $1,023 | $12,510 | $4,460 | $8,050 |
| 2019 | $1,013 | $12,510 | $4,460 | $8,050 |
| 2018 | $971 | $11,940 | $4,490 | $7,450 |
| 2017 | $1,002 | $11,940 | $4,490 | $7,450 |
| 2016 | $1,089 | $13,420 | $4,960 | $8,460 |
| 2015 | $1,105 | $13,420 | $4,960 | $8,460 |
| 2013 | $1,105 | $13,420 | $4,960 | $8,460 |
Source: Public Records
Map
Nearby Homes
Your Personal Tour Guide
Ask me questions while you tour the home.