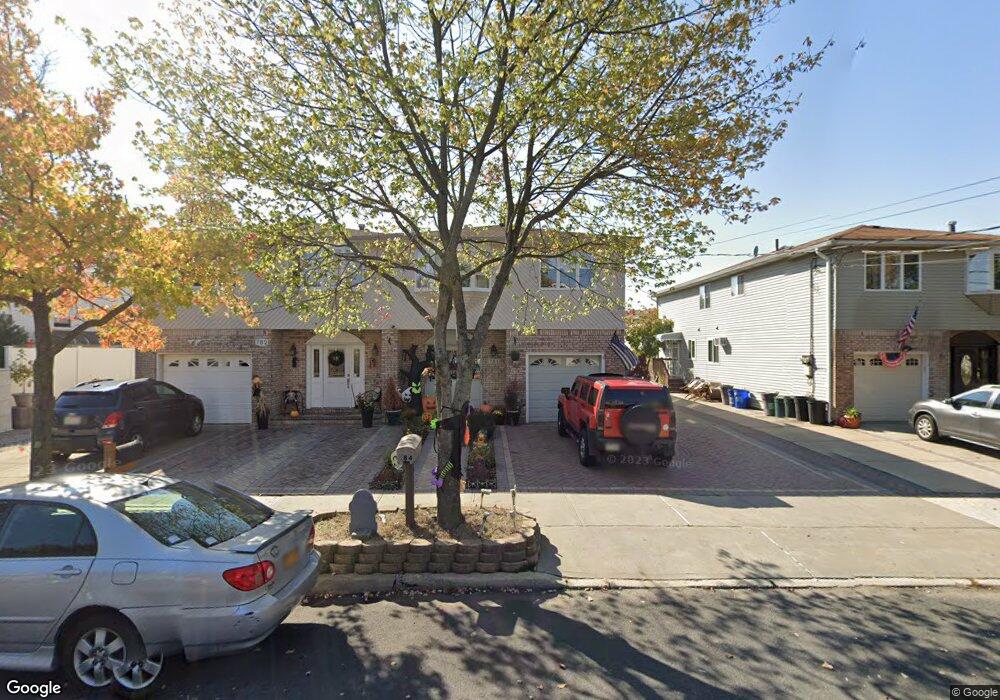
784 Rossville Ave Staten Island, NY 10309
Rossville NeighborhoodEstimated Value: $879,196 - $1,059,000
3
Beds
3
Baths
2,496
Sq Ft
$396/Sq Ft
Est. Value
About This Home
This home is located at 784 Rossville Ave, Staten Island, NY 10309 and is currently estimated at $987,299, approximately $395 per square foot. 784 Rossville Ave is a home located in Richmond County with nearby schools including P.S. 56 - The Louis Desario School, Is 34 Tottenville, and Tottenville High School.
Ownership History
Date
Name
Owned For
Owner Type
Purchase Details
Closed on
May 22, 2024
Sold by
Guerra-Larosa Ann Marie and Guerra Ann Marie
Bought by
Larosa Joseph
Current Estimated Value
Purchase Details
Closed on
Oct 19, 2011
Sold by
Conenna Vito and Conenna Patricia
Bought by
Guerra Larosa Ann Marie and Larosa Joseph
Home Financials for this Owner
Home Financials are based on the most recent Mortgage that was taken out on this home.
Original Mortgage
$387,280
Interest Rate
4.11%
Mortgage Type
New Conventional
Purchase Details
Closed on
Oct 4, 2006
Sold by
Conenna Vito and Conenna Clara
Bought by
Conenna Vito and Conenna Patricia
Home Financials for this Owner
Home Financials are based on the most recent Mortgage that was taken out on this home.
Original Mortgage
$200,000
Interest Rate
6.33%
Mortgage Type
Seller Take Back
Create a Home Valuation Report for This Property
The Home Valuation Report is an in-depth analysis detailing your home's value as well as a comparison with similar homes in the area
Home Values in the Area
Average Home Value in this Area
Purchase History
| Date | Buyer | Sale Price | Title Company |
|---|---|---|---|
| Larosa Joseph | $121,000 | None Listed On Document | |
| Guerra Larosa Ann Marie | $484,100 | Stewart Title Insurance Co | |
| Conenna Vito | $200,000 | The Judicial Title Insurance |
Source: Public Records
Mortgage History
| Date | Status | Borrower | Loan Amount |
|---|---|---|---|
| Previous Owner | Guerra Larosa Ann Marie | $387,280 | |
| Previous Owner | Conenna Vito | $200,000 |
Source: Public Records
Tax History Compared to Growth
Tax History
| Year | Tax Paid | Tax Assessment Tax Assessment Total Assessment is a certain percentage of the fair market value that is determined by local assessors to be the total taxable value of land and additions on the property. | Land | Improvement |
|---|---|---|---|---|
| 2025 | $7,986 | $54,420 | $7,362 | $47,058 |
| 2024 | $7,998 | $45,180 | $8,800 | $36,380 |
| 2023 | $7,602 | $38,831 | $7,934 | $30,897 |
| 2022 | $7,026 | $38,460 | $9,660 | $28,800 |
| 2021 | $6,970 | $38,640 | $9,660 | $28,980 |
| 2020 | $7,019 | $40,140 | $9,660 | $30,480 |
| 2019 | $6,882 | $39,840 | $9,660 | $30,180 |
| 2018 | $6,299 | $32,359 | $8,597 | $23,762 |
| 2017 | $5,923 | $30,528 | $8,387 | $22,141 |
| 2016 | $5,448 | $28,800 | $9,660 | $19,140 |
| 2015 | $5,234 | $28,860 | $8,040 | $20,820 |
| 2014 | $5,234 | $28,860 | $8,040 | $20,820 |
Source: Public Records
Map
Nearby Homes
- 47 Hemlock St
- 234 Gervil St
- 230 Gervil St
- 735 Maguire Ave
- 739 Maguire Ave
- 728 Maguire Ave
- 732 Maguire Ave
- 736 Maguire Ave
- 740 Maguire Ave
- 91 Bombay St
- 87 Bombay St
- 83 Bombay St
- 79 Bombay St
- 75 Bombay St
- 71 Bombay St
- 192 Mason Blvd
- 132 Gervil St Unit 2ndFl
- 132 Gervil St Unit 2fl
- 591 Correll Ave Unit 146
- 0 Woodrow Rd
- 786 Rossville Ave
- 782 Rossville Ave
- 788 Rossville Ave
- 776 Rossville Ave
- 39 Hemlock St
- 35 Hemlock St
- 790 Rossville Ave
- 774 Rossville Ave
- 31 Hemlock St
- 43 Hemlock St
- 27 Hemlock St
- 45 Hemlock St
- 792 Rossville Ave
- 772 Rossville Ave
- 49 Hemlock St
- 796 Rossville Ave
- 770 Rossville Ave
- 785 Rossville Ave
- 787 Rossville Ave
- 19 Hemlock St