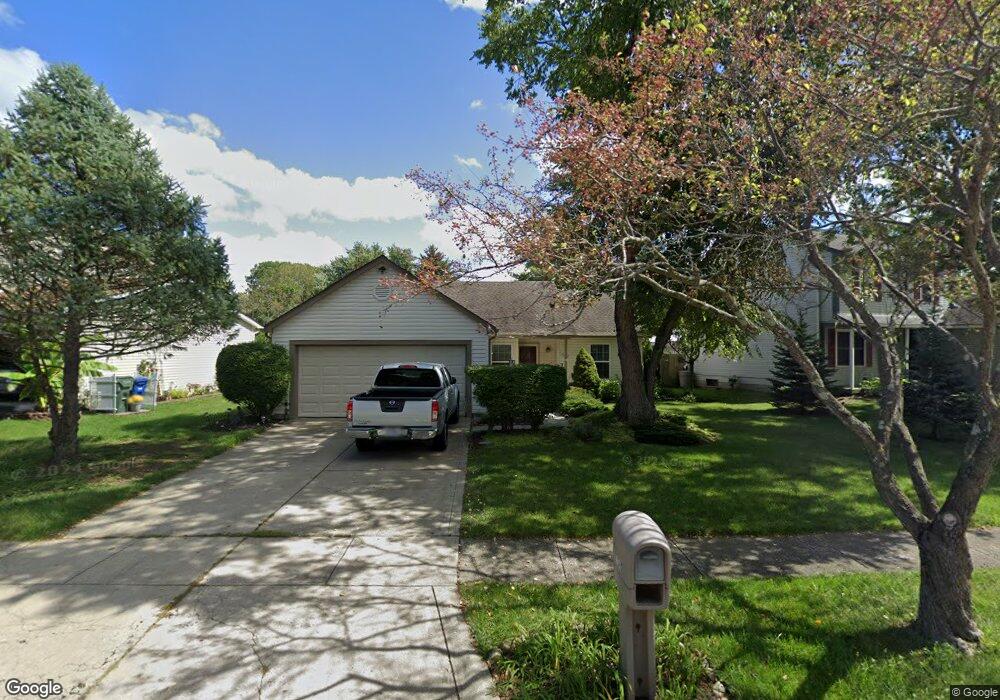
7840 Stanburn Rd Columbus, OH 43235
Foxboro NeighborhoodEstimated Value: $312,923 - $334,000
3
Beds
2
Baths
1,245
Sq Ft
$258/Sq Ft
Est. Value
About This Home
This home is located at 7840 Stanburn Rd, Columbus, OH 43235 and is currently estimated at $321,481, approximately $258 per square foot. 7840 Stanburn Rd is a home located in Franklin County with nearby schools including Albert Chapman Elementary School, Ann Simpson Davis Middle School, and Dublin Scioto High School.
Ownership History
Date
Name
Owned For
Owner Type
Purchase Details
Closed on
Feb 12, 2010
Sold by
Dematteo Joanne
Bought by
Cruz Frank and Valle Lourdes J
Current Estimated Value
Home Financials for this Owner
Home Financials are based on the most recent Mortgage that was taken out on this home.
Original Mortgage
$104,000
Interest Rate
5.11%
Mortgage Type
Purchase Money Mortgage
Purchase Details
Closed on
Nov 20, 2002
Sold by
Feerer Karin M
Bought by
Dematteo Joanne
Home Financials for this Owner
Home Financials are based on the most recent Mortgage that was taken out on this home.
Original Mortgage
$103,900
Interest Rate
6.38%
Mortgage Type
Purchase Money Mortgage
Purchase Details
Closed on
Apr 30, 1999
Sold by
Krinsky Barnet and Krinsky Eunice L
Bought by
Feerer Karin M
Purchase Details
Closed on
Jun 4, 1992
Purchase Details
Closed on
Nov 12, 1987
Create a Home Valuation Report for This Property
The Home Valuation Report is an in-depth analysis detailing your home's value as well as a comparison with similar homes in the area
Home Values in the Area
Average Home Value in this Area
Purchase History
| Date | Buyer | Sale Price | Title Company |
|---|---|---|---|
| Cruz Frank | -- | Attorney | |
| Dematteo Joanne | $129,900 | -- | |
| Feerer Karin M | $115,000 | Chicago Title | |
| -- | $85,000 | -- | |
| -- | $67,100 | -- |
Source: Public Records
Mortgage History
| Date | Status | Borrower | Loan Amount |
|---|---|---|---|
| Previous Owner | Cruz Frank | $104,000 | |
| Previous Owner | Dematteo Joanne | $103,900 |
Source: Public Records
Tax History Compared to Growth
Tax History
| Year | Tax Paid | Tax Assessment Tax Assessment Total Assessment is a certain percentage of the fair market value that is determined by local assessors to be the total taxable value of land and additions on the property. | Land | Improvement |
|---|---|---|---|---|
| 2024 | $4,941 | $81,690 | $34,300 | $47,390 |
| 2023 | $4,871 | $81,690 | $34,300 | $47,390 |
| 2022 | $3,762 | $58,630 | $17,850 | $40,780 |
| 2021 | $3,823 | $58,630 | $17,850 | $40,780 |
| 2020 | $3,800 | $58,630 | $17,850 | $40,780 |
| 2019 | $3,516 | $48,030 | $14,880 | $33,150 |
| 2018 | $3,434 | $48,030 | $14,880 | $33,150 |
| 2017 | $3,282 | $48,030 | $14,880 | $33,150 |
| 2016 | $3,317 | $46,100 | $13,200 | $32,900 |
| 2015 | $3,338 | $46,100 | $13,200 | $32,900 |
| 2014 | $3,341 | $46,100 | $13,200 | $32,900 |
| 2013 | $1,696 | $46,095 | $13,195 | $32,900 |
Source: Public Records
Map
Nearby Homes
- 2469 Sandstrom Dr
- 2462 Sanford Dr
- 2456 Sanford Dr
- 2488 Dunstan Dr
- 2392 Dunsworth Dr
- 7871 Thornfield Ln
- 2423 Sutter Pkwy
- 7917 Meadowhaven Blvd Unit 11
- 2620 Cedar Lake Dr Unit 2620
- 2220 Surreygate Dr
- 2475 Slateshire Dr
- 7607-7609 Penwood Place
- 3915 Inverness Cir Unit 3915
- 2074 Hard Rd
- 7373 Palmleaf Ln
- 2161 Heatherfield Ave
- 7385 Cimmaron Station
- 1996 Starbridge Ct
- 2001 Sawbury Blvd Unit 2001
- 7774 Essex Gate Dr S Unit 7774
- 0 Sandstrom Dr
- 7846 Stanburn Rd
- 7834 Stanburn Rd
- 7852 Stanburn Rd
- 2464 Sandstrom Dr
- 2456 Sandstrom Dr
- 7858 Stanburn Rd
- 7837 Stanburn Rd
- 7831 Stanburn Rd
- 7843 Stanburn Rd
- 7849 Stanburn Rd
- 7855 Stanburn Rd
- 7825 Stanburn Rd
- 7864 Stanburn Rd
- 2448 Sandstrom Dr
- 2477 Sandstrom Dr
- 2461 Sandstrom Dr
- 7819 Stanburn Rd
- 2435 Bradenton Ct
- 2473 Dunstan Dr