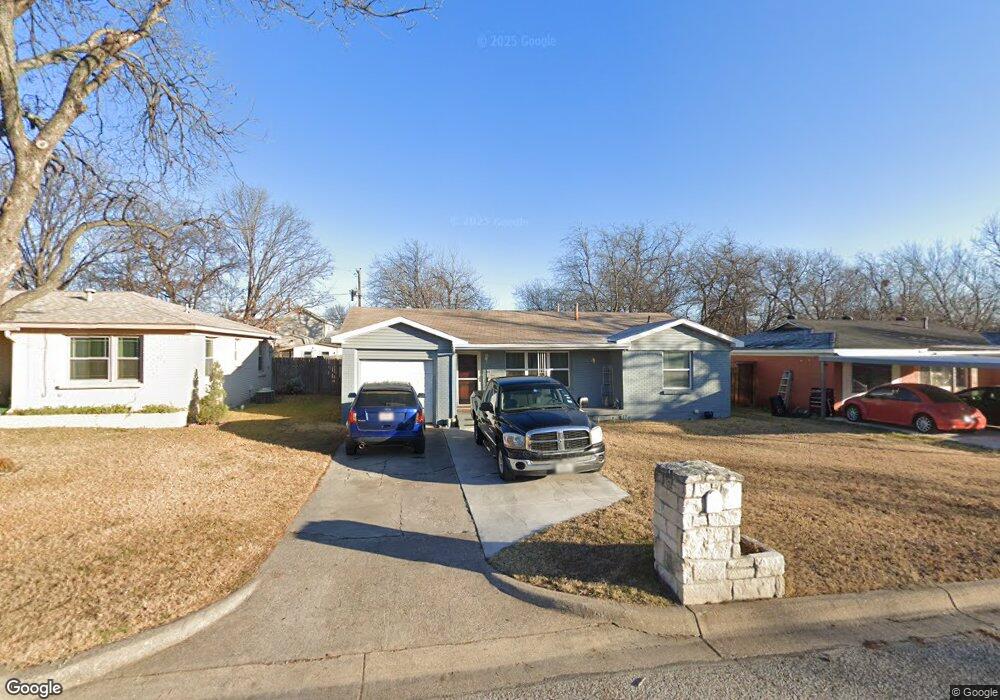
7840 Terry St Fort Worth, TX 76108
Estimated Value: $231,940 - $268,000
3
Beds
2
Baths
1,460
Sq Ft
$167/Sq Ft
Est. Value
About This Home
This home is located at 7840 Terry St, Fort Worth, TX 76108 and is currently estimated at $243,235, approximately $166 per square foot. 7840 Terry St is a home located in Tarrant County with nearby schools including Liberty Elementary School, Brewer Middle School, and Tannahill Intermediate School.
Ownership History
Date
Name
Owned For
Owner Type
Purchase Details
Closed on
Feb 13, 2019
Sold by
Remix Investments Llc
Bought by
Wright Margaret and Wright Roger
Current Estimated Value
Purchase Details
Closed on
May 17, 2018
Sold by
Shelley Peggy L
Bought by
Remix Investments Llc
Purchase Details
Closed on
Oct 27, 2009
Sold by
Mills Chad W
Bought by
Shelley Peggy L
Home Financials for this Owner
Home Financials are based on the most recent Mortgage that was taken out on this home.
Original Mortgage
$74,582
Interest Rate
5.05%
Mortgage Type
FHA
Purchase Details
Closed on
Oct 17, 2002
Sold by
Stringer John T and Stringer Elsie G
Bought by
Mills Chad W
Home Financials for this Owner
Home Financials are based on the most recent Mortgage that was taken out on this home.
Original Mortgage
$69,000
Interest Rate
7%
Create a Home Valuation Report for This Property
The Home Valuation Report is an in-depth analysis detailing your home's value as well as a comparison with similar homes in the area
Home Values in the Area
Average Home Value in this Area
Purchase History
| Date | Buyer | Sale Price | Title Company |
|---|---|---|---|
| Wright Margaret | -- | First American Title | |
| Remix Investments Llc | -- | First Amer Title Ins Co | |
| Shelley Peggy L | -- | First Land Title | |
| Mills Chad W | -- | Metroplex Title Inc |
Source: Public Records
Mortgage History
| Date | Status | Borrower | Loan Amount |
|---|---|---|---|
| Previous Owner | Shelley Peggy L | $74,582 | |
| Previous Owner | Mills Chad W | $69,000 |
Source: Public Records
Tax History Compared to Growth
Tax History
| Year | Tax Paid | Tax Assessment Tax Assessment Total Assessment is a certain percentage of the fair market value that is determined by local assessors to be the total taxable value of land and additions on the property. | Land | Improvement |
|---|---|---|---|---|
| 2025 | $1,379 | $204,964 | $43,280 | $161,684 |
| 2024 | $1,379 | $204,964 | $43,280 | $161,684 |
| 2023 | $4,384 | $228,058 | $43,280 | $184,778 |
| 2022 | $4,539 | $169,549 | $25,000 | $144,549 |
| 2021 | $4,192 | $158,576 | $25,000 | $133,576 |
| 2020 | $3,839 | $138,532 | $25,000 | $113,532 |
| 2019 | $4,016 | $139,603 | $25,000 | $114,603 |
| 2018 | $331 | $81,457 | $12,000 | $69,457 |
| 2017 | $2,164 | $79,606 | $12,000 | $67,606 |
| 2016 | $1,967 | $78,021 | $12,000 | $66,021 |
| 2015 | $308 | $61,200 | $9,000 | $52,200 |
| 2014 | $308 | $61,200 | $9,000 | $52,200 |
Source: Public Records
Map
Nearby Homes
- 7836 Corina Dr
- 730 S Cherry Ln
- 7805 Whitney Dr
- 852 Odie Dr
- 867 Odie Dr
- 801 Ala Dr
- 149 Wilson Cliff Dr
- 501 Odie Dr
- 537 June Dr
- 633 Kimbrough St
- 872 June Dr
- 7704 Carlos St
- 8017 White Settlement Rd
- 321 Meadow Park Dr
- 2248 Tierra Madre Blvd
- 8232 Redonda St
- 8203 Delmar St
- 2220 Crested Saguaro St
- 2228 Crested Saguaro St
- 8016 Downe Dr