Estimated Value: $768,000 - $924,000
3
Beds
3
Baths
2,498
Sq Ft
$325/Sq Ft
Est. Value
About This Home
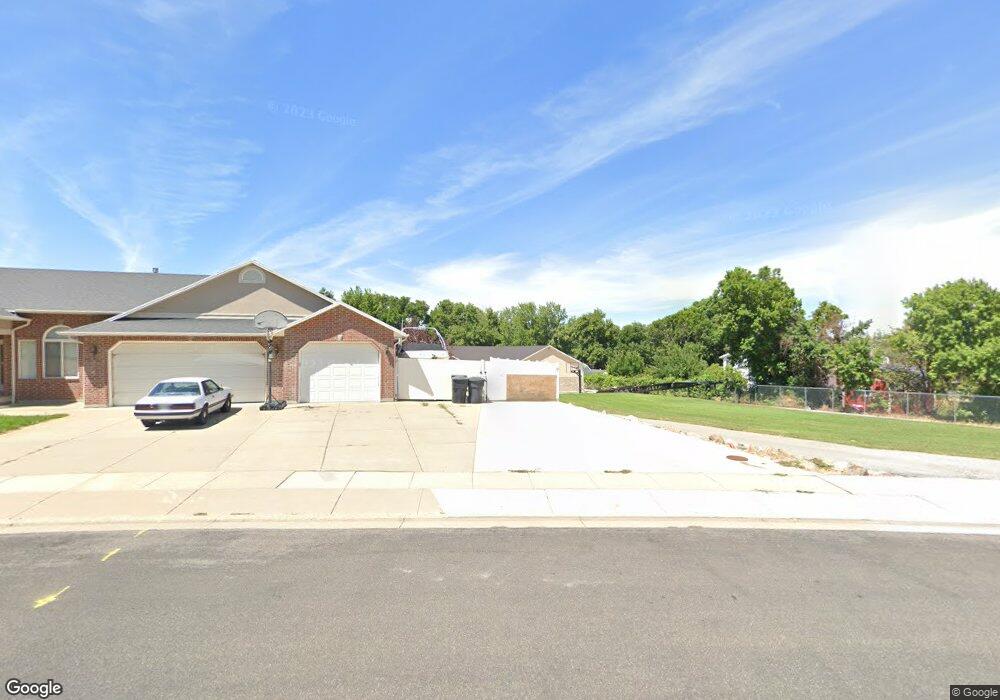
This home is located at 7841 S 2600 E, Ogden, UT 84405 and is currently estimated at $812,975, approximately $325 per square foot. 7841 S 2600 E is a home located in Davis County with nearby schools including South Weber Elementary School, Sunset Junior High School, and Northridge High School.
Ownership History
Date
Name
Owned For
Owner Type
Purchase Details
Closed on
Sep 16, 2024
Sold by
Gregg B Belnap Family Trust and Belnap Gregg B
Bought by
Belnap Robin
Current Estimated Value
Home Financials for this Owner
Home Financials are based on the most recent Mortgage that was taken out on this home.
Original Mortgage
$256,000
Outstanding Balance
$252,121
Interest Rate
6.47%
Mortgage Type
New Conventional
Estimated Equity
$560,854
Purchase Details
Closed on
Sep 13, 2024
Sold by
Belnap Robin
Bought by
Robin E Belnap Family Inter Vivos Revocable T and Belnap
Home Financials for this Owner
Home Financials are based on the most recent Mortgage that was taken out on this home.
Original Mortgage
$256,000
Outstanding Balance
$252,121
Interest Rate
6.47%
Mortgage Type
New Conventional
Estimated Equity
$560,854
Purchase Details
Closed on
Oct 16, 2013
Sold by
Belnap Gregg B
Bought by
Belnap Gregg B and Belnap Robin E
Home Financials for this Owner
Home Financials are based on the most recent Mortgage that was taken out on this home.
Original Mortgage
$265,000
Interest Rate
4.55%
Mortgage Type
Purchase Money Mortgage
Purchase Details
Closed on
Sep 19, 2011
Sold by
Belnap Gregg
Bought by
Belnap Robin E and Belnap Gregg B
Home Financials for this Owner
Home Financials are based on the most recent Mortgage that was taken out on this home.
Original Mortgage
$280,000
Interest Rate
3.43%
Mortgage Type
New Conventional
Purchase Details
Closed on
Aug 19, 2011
Sold by
Belnap Robin E and Belnap Gregg B
Bought by
Belnap Gregg
Home Financials for this Owner
Home Financials are based on the most recent Mortgage that was taken out on this home.
Original Mortgage
$280,000
Interest Rate
3.43%
Mortgage Type
New Conventional
Purchase Details
Closed on
Nov 12, 2003
Sold by
Belnap Robin E and Belnap Gregg B
Bought by
Belnap Robin E and Belnap Gregg B
Home Financials for this Owner
Home Financials are based on the most recent Mortgage that was taken out on this home.
Original Mortgage
$160,750
Interest Rate
5.06%
Mortgage Type
Purchase Money Mortgage
Purchase Details
Closed on
Sep 27, 2002
Sold by
Belnap Robin E and Belnap Gregg B
Bought by
Belnap Robin E and Belnap Gregg B
Purchase Details
Closed on
Jul 3, 1997
Sold by
Belnap Gregg Bennett and Belnap Gregg Bennett
Bought by
Belnap Gregg B and Belnap Robin E
Home Financials for this Owner
Home Financials are based on the most recent Mortgage that was taken out on this home.
Original Mortgage
$170,400
Interest Rate
7.92%
Create a Home Valuation Report for This Property
The Home Valuation Report is an in-depth analysis detailing your home's value as well as a comparison with similar homes in the area
Purchase History
| Date | Buyer | Sale Price | Title Company |
|---|---|---|---|
| Belnap Robin | -- | Bhava Title Insurance Agency L | |
| Robin E Belnap Family Inter Vivos Revocable T | -- | Bhava Title Insurance Agercy L | |
| Belnap Robin | -- | Bhava Title Insurance Agency L | |
| Belnap Gregg B | -- | Dep Ecash Recd For Benchmark | |
| Belnap Gregg B | -- | Benchmark Title Ins | |
| Belnap Robin E | -- | Accommodation | |
| Belnap Gregg | -- | Backman Title Servic | |
| Belnap Robin E | -- | Backman Stewart Title Servic | |
| Belnap Gregg B | -- | Backman Stewart Title Servic | |
| Belnap Robin E | -- | -- | |
| Belnap Gregg B | -- | Associated Title Company |
Source: Public Records
Mortgage History
| Date | Status | Borrower | Loan Amount |
|---|---|---|---|
| Open | Belnap Robin | $256,000 | |
| Previous Owner | Belnap Gregg B | $265,000 | |
| Previous Owner | Belnap Gregg | $280,000 | |
| Previous Owner | Belnap Gregg B | $160,750 | |
| Previous Owner | Belnap Gregg B | $170,400 |
Source: Public Records
Tax History
| Year | Tax Paid | Tax Assessment Tax Assessment Total Assessment is a certain percentage of the fair market value that is determined by local assessors to be the total taxable value of land and additions on the property. | Land | Improvement |
|---|---|---|---|---|
| 2025 | $4,356 | $395,450 | $148,475 | $246,975 |
| 2024 | $4,051 | $374,550 | $125,988 | $248,562 |
| 2023 | $4,101 | $695,000 | $201,431 | $493,569 |
| 2022 | $4,342 | $750,000 | $216,582 | $533,418 |
| 2021 | $3,774 | $532,000 | $169,233 | $362,767 |
| 2020 | $3,395 | $477,000 | $154,341 | $322,659 |
| 2019 | $3,229 | $437,000 | $137,567 | $299,433 |
| 2018 | $2,908 | $410,000 | $122,004 | $287,996 |
| 2016 | $2,807 | $206,030 | $56,604 | $149,426 |
| 2015 | $2,673 | $184,745 | $56,604 | $128,141 |
| 2014 | $2,433 | $169,473 | $65,063 | $104,410 |
| 2013 | -- | $163,052 | $57,943 | $105,109 |
Source: Public Records
Map
Nearby Homes
- 7897 S 2700 E Unit 303
- 7897 S 2700 E Unit 305
- 7841 Peachwood Dr
- 2765 E 7825 S
- 2357 E 8100 S
- 8149 S 2425 E
- 8271 S 2600 E
- 7886 S 2100 E
- 7478 1980 E
- 2772 E 3575 N
- 3532 N Layton Ridge Dr
- 3297 N Layton Ridge Dr
- 2553 E 6550 S
- 7212 S Harolds Way
- 3087 N 2250 E
- 1873 E 7600 S
- 3232 N Redtail Way
- 6548 Bybee Dr Unit 3
- 2353 Canyon View Dr
- 6464 Bybee Dr
Your Personal Tour Guide
Ask me questions while you tour the home.