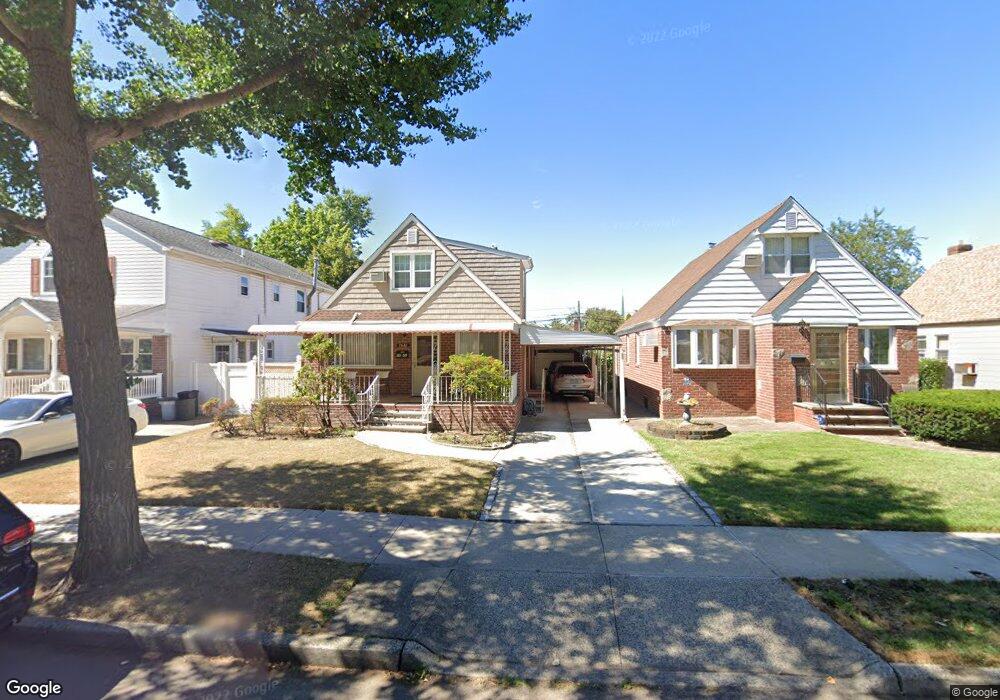
7842 265th St Glen Oaks, NY 11004
Estimated Value: $818,366 - $889,000
--
Bed
--
Bath
1,080
Sq Ft
$791/Sq Ft
Est. Value
About This Home
This home is located at 7842 265th St, Glen Oaks, NY 11004 and is currently estimated at $854,092, approximately $790 per square foot. 7842 265th St is a home located in Queens County with nearby schools including P.S.115Q James J Ambrose School, Fremont/Hay Elementary School, and Irwin Altman Middle School 172.
Ownership History
Date
Name
Owned For
Owner Type
Purchase Details
Closed on
Jan 23, 2013
Sold by
Mathew Lovely and Mathew Thomas
Bought by
Mammen Jacob and Mammen Roselin J
Current Estimated Value
Purchase Details
Closed on
Jan 5, 1998
Sold by
Katz Michael
Bought by
Mathew Thomas and Mathew Lovely
Home Financials for this Owner
Home Financials are based on the most recent Mortgage that was taken out on this home.
Original Mortgage
$23,800
Interest Rate
6.95%
Purchase Details
Closed on
Jun 20, 1997
Sold by
Eisman Jeffrey and Lesorgen Randi
Bought by
Katz Michael
Purchase Details
Closed on
Oct 30, 1994
Sold by
Eisman Florence
Bought by
Eisman Jeffrey and Lesorgen Randi
Create a Home Valuation Report for This Property
The Home Valuation Report is an in-depth analysis detailing your home's value as well as a comparison with similar homes in the area
Home Values in the Area
Average Home Value in this Area
Purchase History
| Date | Buyer | Sale Price | Title Company |
|---|---|---|---|
| Mammen Jacob | $530,000 | -- | |
| Mammen Jacob | $530,000 | -- | |
| Mathew Thomas | $238,000 | Commonwealth Land Title Ins | |
| Mathew Thomas | $238,000 | Commonwealth Land Title Ins | |
| Katz Michael | $155,000 | -- | |
| Katz Michael | $155,000 | -- | |
| Eisman Jeffrey | -- | Commonwealth Land Title Ins | |
| Eisman Jeffrey | -- | Commonwealth Land Title Ins |
Source: Public Records
Mortgage History
| Date | Status | Borrower | Loan Amount |
|---|---|---|---|
| Previous Owner | Mathew Thomas | $23,800 | |
| Closed | Mathew Thomas | $190,400 |
Source: Public Records
Tax History Compared to Growth
Tax History
| Year | Tax Paid | Tax Assessment Tax Assessment Total Assessment is a certain percentage of the fair market value that is determined by local assessors to be the total taxable value of land and additions on the property. | Land | Improvement |
|---|---|---|---|---|
| 2025 | $7,882 | $40,954 | $14,166 | $26,788 |
| 2024 | $7,894 | $40,645 | $13,531 | $27,114 |
| 2023 | $7,420 | $38,345 | $12,977 | $25,368 |
| 2022 | $7,050 | $43,200 | $15,960 | $27,240 |
| 2021 | $6,886 | $40,920 | $15,960 | $24,960 |
| 2020 | $6,928 | $40,200 | $15,960 | $24,240 |
| 2019 | $6,793 | $40,260 | $15,960 | $24,300 |
| 2018 | $6,216 | $31,954 | $12,724 | $19,230 |
| 2017 | $5,846 | $30,146 | $13,254 | $16,892 |
| 2016 | $5,376 | $30,146 | $13,254 | $16,892 |
| 2015 | -- | $28,440 | $14,365 | $14,075 |
| 2014 | -- | $28,226 | $16,129 | $12,097 |
Source: Public Records
Map
Nearby Homes
- 78-07 264th St
- 78-37 267th St
- 79-12 268th St
- 7653 268th St
- 260-18 75th Ave Unit 1st fl
- 78-30 270th St
- 80-18 261st St
- 260-73 75th Ave Unit 1st Fl
- 80-64 266th St
- 7836 271st St
- 78-36 271st St
- 7611 270th St
- 80-59 268th St
- 80-37 259th St
- 263-55 74th Ave Unit A-2
- 81-25 265th St
- 74-12 260th St Unit H-2
- 73-20 263rd St Unit G
- 8143 262nd St
- 80-27 257th St