L
Seller's Agent in 2020
Lisa Davis
Century 21 Smith Branch & Pope
Estimated Value: $103,000 - $151,000
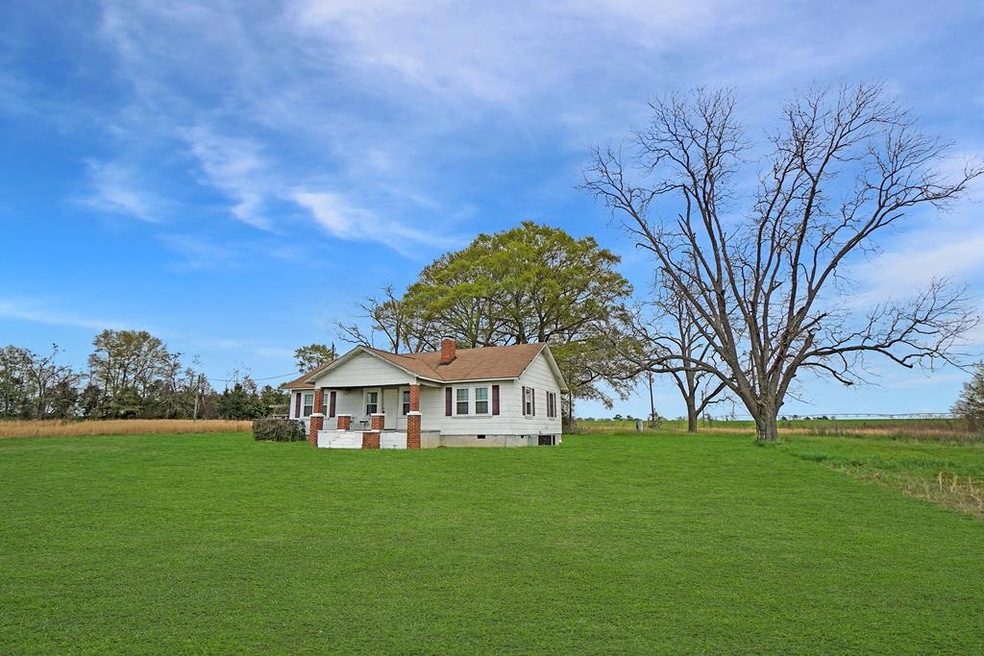
SIMPLISTIC CHARM... This is the perfect home if you are looking for country cottage chic! Located on over two acres, this home serves a ton of character, such as pine floors and pine ceilings that tastefully contrast the crisp white walls. The master bedroom offers an old inn feel with its cozy fireplace & mantle ensemble. The front porch offers a beautiful water view that you are sure to enjoy from your rocking chair. The updated kitchen has specialty cabinets and is very spacious. This home is perfect for any family who prefers country living, yet close to town. Call today for a showing!!
Last Agent to Sell the Property
Lisa Davis
Century 21 Smith Branch & Pope Brokerage Phone: 2293868737 Listed on: 06/25/2020
Last Buyer's Agent
Lisa Davis
Century 21 Smith Branch & Pope Brokerage Phone: 2293868737 Listed on: 06/25/2020
| Date | Buyer | Sale Price | Title Company |
|---|---|---|---|
| Warren Myriam | -- | -- | |
| Warren Myriam | $74,000 | -- | |
| Brown Ryan | -- | -- | |
| Brown Madeline | $12,300 | -- | |
| Nationstar Mtg Llc | -- | -- | |
| Walker John H | -- | -- | |
| Hsbc Mtg Svcs Inc | $54,858 | -- | |
| Sims Ricky | $58,800 | -- |
| Date | Status | Borrower | Loan Amount |
|---|---|---|---|
| Open | Warren Myriam | $59,000 |
| Date | Event | Price | List to Sale | Price per Sq Ft |
|---|---|---|---|---|
| 08/20/2020 08/20/20 | Sold | $74,000 | -- | $59 / Sq Ft |
| 06/25/2020 06/25/20 | Pending | -- | -- | -- |
| Year | Tax Paid | Tax Assessment Tax Assessment Total Assessment is a certain percentage of the fair market value that is determined by local assessors to be the total taxable value of land and additions on the property. | Land | Improvement |
|---|---|---|---|---|
| 2024 | $944 | $23,819 | $7,944 | $15,875 |
| 2023 | $944 | $23,627 | $7,944 | $15,683 |
| 2022 | $939 | $23,627 | $7,944 | $15,683 |
| 2021 | $916 | $23,627 | $7,944 | $15,683 |
| 2020 | $917 | $23,627 | $7,944 | $15,683 |
| 2019 | $976 | $25,683 | $10,000 | $15,683 |
| 2018 | $736 | $25,683 | $10,000 | $15,683 |
| 2017 | $736 | $25,683 | $10,000 | $15,683 |
| 2016 | $736 | $25,683 | $10,000 | $15,683 |
| 2015 | $737 | $25,683 | $10,000 | $15,683 |
| 2014 | $737 | $25,683 | $10,000 | $15,683 |
| 2013 | -- | $23,523 | $7,840 | $15,683 |
| 2012 | -- | $23,523 | $7,840 | $15,683 |
L
Seller's Agent in 2020
Lisa Davis
Century 21 Smith Branch & Pope
Source: Albany Board of REALTORS®
MLS Number: 144888
APN: 00340-026--29