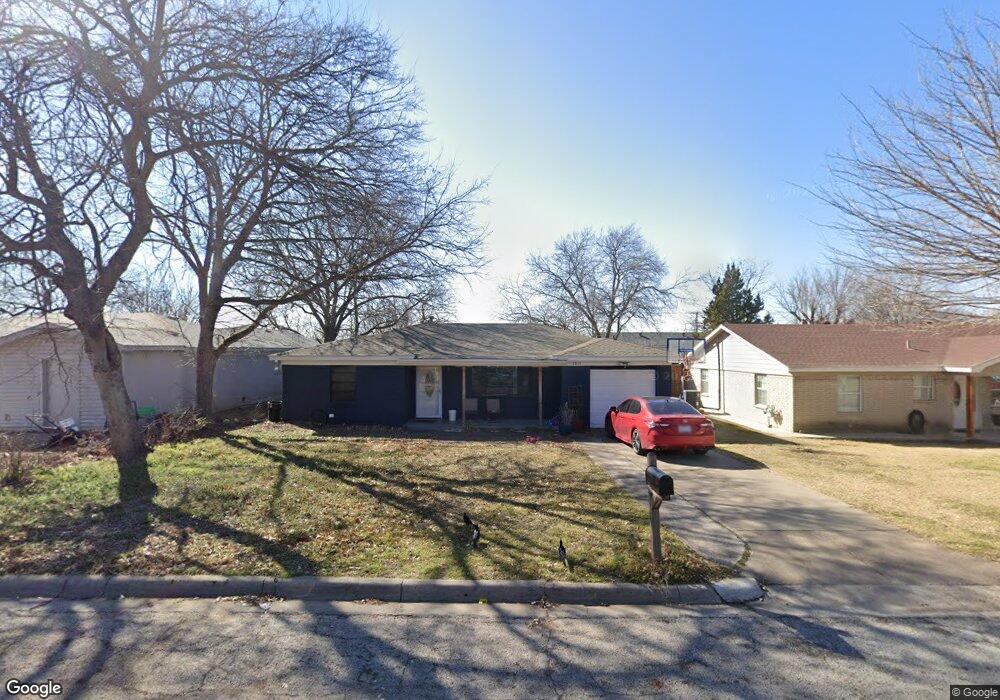
7845 Abbott Dr Fort Worth, TX 76108
Estimated Value: $205,000 - $237,000
3
Beds
1
Bath
1,191
Sq Ft
$185/Sq Ft
Est. Value
About This Home
This home is located at 7845 Abbott Dr, Fort Worth, TX 76108 and is currently estimated at $220,774, approximately $185 per square foot. 7845 Abbott Dr is a home located in Tarrant County with nearby schools including Liberty Elementary School, Brewer Middle School, and Tannahill Intermediate School.
Ownership History
Date
Name
Owned For
Owner Type
Purchase Details
Closed on
Jul 7, 2020
Sold by
Dsci Inc
Bought by
Navarro Rene G
Current Estimated Value
Home Financials for this Owner
Home Financials are based on the most recent Mortgage that was taken out on this home.
Original Mortgage
$166,822
Outstanding Balance
$148,201
Interest Rate
3.2%
Mortgage Type
Unknown
Estimated Equity
$72,573
Purchase Details
Closed on
Jan 31, 2020
Sold by
Reed Jimmy
Bought by
Dsci Inc
Home Financials for this Owner
Home Financials are based on the most recent Mortgage that was taken out on this home.
Original Mortgage
$122,400
Interest Rate
3.7%
Mortgage Type
Purchase Money Mortgage
Purchase Details
Closed on
Jul 26, 2005
Sold by
Reed Rachele
Bought by
Reed Jimmy
Home Financials for this Owner
Home Financials are based on the most recent Mortgage that was taken out on this home.
Original Mortgage
$58,500
Interest Rate
5.51%
Mortgage Type
Fannie Mae Freddie Mac
Create a Home Valuation Report for This Property
The Home Valuation Report is an in-depth analysis detailing your home's value as well as a comparison with similar homes in the area
Home Values in the Area
Average Home Value in this Area
Purchase History
| Date | Buyer | Sale Price | Title Company |
|---|---|---|---|
| Navarro Rene G | -- | Stc | |
| Dsci Inc | -- | None Available | |
| Reed Jimmy | -- | Title Partners-American |
Source: Public Records
Mortgage History
| Date | Status | Borrower | Loan Amount |
|---|---|---|---|
| Open | Navarro Rene G | $166,822 | |
| Previous Owner | Dsci Inc | $122,400 | |
| Previous Owner | Reed Jimmy | $58,500 |
Source: Public Records
Tax History Compared to Growth
Tax History
| Year | Tax Paid | Tax Assessment Tax Assessment Total Assessment is a certain percentage of the fair market value that is determined by local assessors to be the total taxable value of land and additions on the property. | Land | Improvement |
|---|---|---|---|---|
| 2025 | $3,490 | $204,000 | $42,940 | $161,060 |
| 2024 | $3,490 | $222,783 | $42,940 | $179,843 |
| 2023 | $5,884 | $247,464 | $42,940 | $204,524 |
| 2022 | $4,875 | $180,020 | $25,000 | $155,020 |
| 2021 | $4,736 | $172,171 | $25,000 | $147,171 |
| 2020 | $3,131 | $113,000 | $25,000 | $88,000 |
| 2019 | $3,251 | $113,000 | $25,000 | $88,000 |
| 2018 | $2,301 | $80,000 | $12,000 | $68,000 |
| 2017 | $2,338 | $80,000 | $12,000 | $68,000 |
| 2016 | $1,870 | $64,002 | $12,000 | $52,002 |
| 2015 | $1,528 | $53,200 | $9,000 | $44,200 |
| 2014 | $1,528 | $53,200 | $9,000 | $44,200 |
Source: Public Records
Map
Nearby Homes