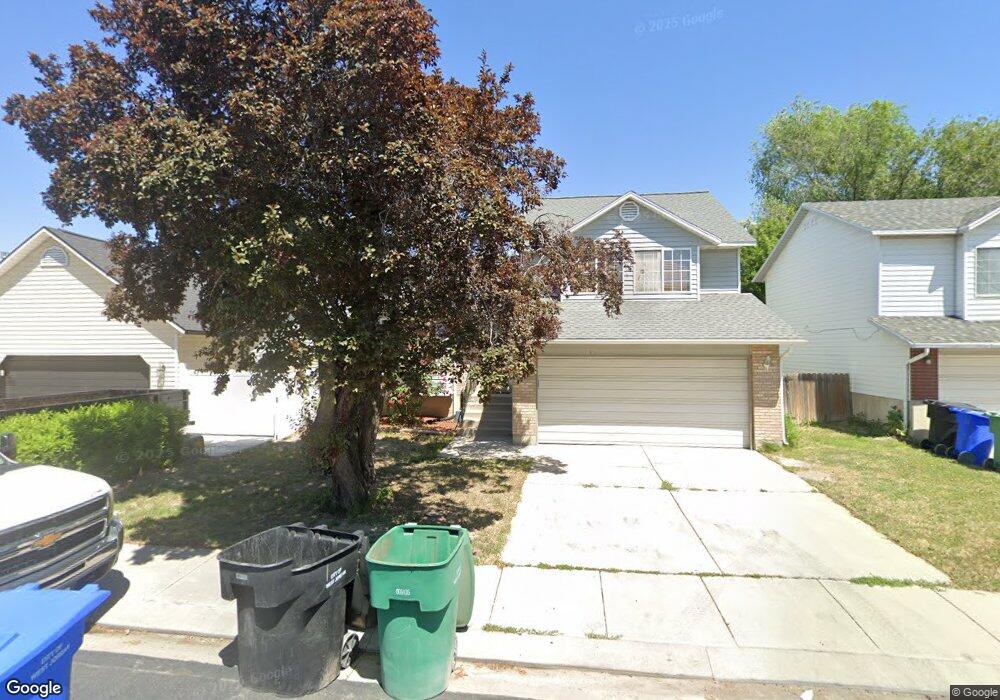
7845 Palladium Dr West Jordan, UT 84088
Estimated Value: $462,571 - $523,000
4
Beds
2
Baths
1,876
Sq Ft
$267/Sq Ft
Est. Value
About This Home
This home is located at 7845 Palladium Dr, West Jordan, UT 84088 and is currently estimated at $500,893, approximately $267 per square foot. 7845 Palladium Dr is a home located in Salt Lake County with nearby schools including Columbia Elementary School, Joel P. Jensen Middle School, and West Jordan High School.
Ownership History
Date
Name
Owned For
Owner Type
Purchase Details
Closed on
May 4, 2017
Sold by
King Melanie
Bought by
Rogers Christine and Rogers Robert
Current Estimated Value
Home Financials for this Owner
Home Financials are based on the most recent Mortgage that was taken out on this home.
Original Mortgage
$11,950
Outstanding Balance
$9,973
Interest Rate
4.23%
Mortgage Type
Stand Alone Second
Estimated Equity
$490,920
Purchase Details
Closed on
Aug 8, 2011
Sold by
King David W and King Melanie
Bought by
King Melanie
Home Financials for this Owner
Home Financials are based on the most recent Mortgage that was taken out on this home.
Original Mortgage
$135,542
Interest Rate
3.75%
Mortgage Type
FHA
Purchase Details
Closed on
Oct 24, 1997
Sold by
Morris John Clifton and Morris Alecia M
Bought by
King David W and King Susanna M
Home Financials for this Owner
Home Financials are based on the most recent Mortgage that was taken out on this home.
Original Mortgage
$134,640
Interest Rate
7.49%
Mortgage Type
VA
Create a Home Valuation Report for This Property
The Home Valuation Report is an in-depth analysis detailing your home's value as well as a comparison with similar homes in the area
Home Values in the Area
Average Home Value in this Area
Purchase History
| Date | Buyer | Sale Price | Title Company |
|---|---|---|---|
| Rogers Christine | -- | Surety Title | |
| King Melanie | -- | None Available | |
| King David W | -- | -- |
Source: Public Records
Mortgage History
| Date | Status | Borrower | Loan Amount |
|---|---|---|---|
| Open | Rogers Christine | $11,950 | |
| Open | Rogers Christine | $252,200 | |
| Previous Owner | King David W | $134,640 |
Source: Public Records
Tax History Compared to Growth
Tax History
| Year | Tax Paid | Tax Assessment Tax Assessment Total Assessment is a certain percentage of the fair market value that is determined by local assessors to be the total taxable value of land and additions on the property. | Land | Improvement |
|---|---|---|---|---|
| 2025 | $2,186 | $426,900 | $86,800 | $340,100 |
| 2024 | $2,186 | $420,500 | $85,200 | $335,300 |
| 2023 | $2,398 | $434,900 | $81,900 | $353,000 |
| 2022 | $2,375 | $423,700 | $80,300 | $343,400 |
| 2021 | $1,976 | $320,900 | $57,200 | $263,700 |
| 2020 | $1,892 | $288,300 | $57,200 | $231,100 |
| 2019 | $1,882 | $281,200 | $57,200 | $224,000 |
| 2018 | $1,723 | $255,400 | $55,000 | $200,400 |
| 2017 | $1,447 | $213,500 | $55,000 | $158,500 |
| 2016 | $1,370 | $190,000 | $55,000 | $135,000 |
| 2015 | $1,367 | $184,800 | $56,000 | $128,800 |
| 2014 | $1,398 | $186,100 | $57,100 | $129,000 |
Source: Public Records
Map
Nearby Homes
- 3476 W Spaulding Rd
- 3354 W 7800 S
- 3546 W 7980 S
- 3631 W 7910 S
- 8058 S Lismore Ln Unit 304
- 3332 Lower Newark Way
- 3559 W Lexington View Dr
- 3165 W 7720 S
- 7955 S 3685 W
- 7989 S 3725 W
- 3504 W 8245 S
- 7721 Sunset Cir
- 7778 S Strawberry Loop
- 3657 W 8240 S
- 7357 S 3285 W
- 2886 W 7550 S
- 3816 W Elwood Way
- 3502 W 8350 S
- 3385 Marjorie Ct
- 3847 Elwood Way
- 7845 S Palladium Dr
- 7853 Palladium Dr
- 7837 Palladium Dr
- 7837 S Palladium Dr
- 8230 S 3400 W Unit 2
- 7861 S Palladium Dr
- 7861 Palladium Dr
- 7829 Palladium Dr
- 7829 S Palladium Dr
- 3430 Charlesworth Cir
- 3429 Beckford Cir
- 7867 Palladium Dr
- 7867 S Palladium Dr
- 7821 Palladium Dr
- 7821 S Palladium Dr
- 3438 W Charlesworth Cir
- 3438 Charlesworth Cir
- 3437 Beckford Cir
- 3437 W Beckford Cir
- 7873 S Palladium Dr