7847 Keepsake Ln Flowery Branch, GA 30542
Sterling on the Lake NeighborhoodEstimated Value: $429,000 - $451,000
3
Beds
3
Baths
2,103
Sq Ft
$208/Sq Ft
Est. Value
About This Home
This home is located at 7847 Keepsake Ln, Flowery Branch, GA 30542 and is currently estimated at $437,826, approximately $208 per square foot. 7847 Keepsake Ln is a home located in Hall County with nearby schools including Spout Springs Elementary School, Cherokee Bluff Middle School, and Cherokee Bluff High School.
Ownership History
Date
Name
Owned For
Owner Type
Purchase Details
Closed on
Sep 23, 2017
Sold by
Oppong Kwesi
Bought by
Oppong Kwesi and Oppong Sunai
Current Estimated Value
Home Financials for this Owner
Home Financials are based on the most recent Mortgage that was taken out on this home.
Original Mortgage
$211,500
Outstanding Balance
$176,427
Interest Rate
3.86%
Mortgage Type
New Conventional
Estimated Equity
$261,399
Purchase Details
Closed on
Jun 11, 2010
Sold by
Oppong Kwesi and Oppong Sunai O
Bought by
Oppong Kwesi
Home Financials for this Owner
Home Financials are based on the most recent Mortgage that was taken out on this home.
Original Mortgage
$187,160
Interest Rate
4.91%
Mortgage Type
New Conventional
Purchase Details
Closed on
Aug 30, 2006
Sold by
Oppong Kwesi
Bought by
Oppong Kwesi and Oppong Sunai O
Home Financials for this Owner
Home Financials are based on the most recent Mortgage that was taken out on this home.
Original Mortgage
$181,096
Interest Rate
6.88%
Mortgage Type
New Conventional
Purchase Details
Closed on
Dec 12, 2005
Sold by
Nnp-Looper Lake Llc
Bought by
The Ryland Group Inc
Create a Home Valuation Report for This Property
The Home Valuation Report is an in-depth analysis detailing your home's value as well as a comparison with similar homes in the area
Home Values in the Area
Average Home Value in this Area
Purchase History
| Date | Buyer | Sale Price | Title Company |
|---|---|---|---|
| Oppong Kwesi | -- | -- | |
| Oppong Kwesi | -- | -- | |
| Oppong Kwesi | -- | -- | |
| Oppong Kwesi | $226,400 | -- | |
| The Ryland Group Inc | $399,100 | -- |
Source: Public Records
Mortgage History
| Date | Status | Borrower | Loan Amount |
|---|---|---|---|
| Open | Oppong Kwesi | $211,500 | |
| Previous Owner | Oppong Kwesi | $187,160 | |
| Previous Owner | Oppong Kwesi | $181,096 |
Source: Public Records
Tax History Compared to Growth
Tax History
| Year | Tax Paid | Tax Assessment Tax Assessment Total Assessment is a certain percentage of the fair market value that is determined by local assessors to be the total taxable value of land and additions on the property. | Land | Improvement |
|---|---|---|---|---|
| 2024 | $4,608 | $164,200 | $33,440 | $130,760 |
| 2023 | $3,108 | $142,400 | $33,440 | $108,960 |
| 2022 | $3,053 | $118,680 | $25,080 | $93,600 |
| 2021 | $2,683 | $102,680 | $18,360 | $84,320 |
| 2020 | $2,605 | $97,000 | $17,040 | $79,960 |
| 2019 | $2,562 | $94,600 | $17,040 | $77,560 |
| 2018 | $2,477 | $88,680 | $13,200 | $75,480 |
| 2017 | $2,279 | $79,840 | $13,200 | $66,640 |
| 2016 | $2,072 | $74,440 | $13,200 | $61,240 |
| 2015 | $1,899 | $70,560 | $12,000 | $58,560 |
| 2014 | $1,899 | $67,880 | $12,000 | $55,880 |
Source: Public Records
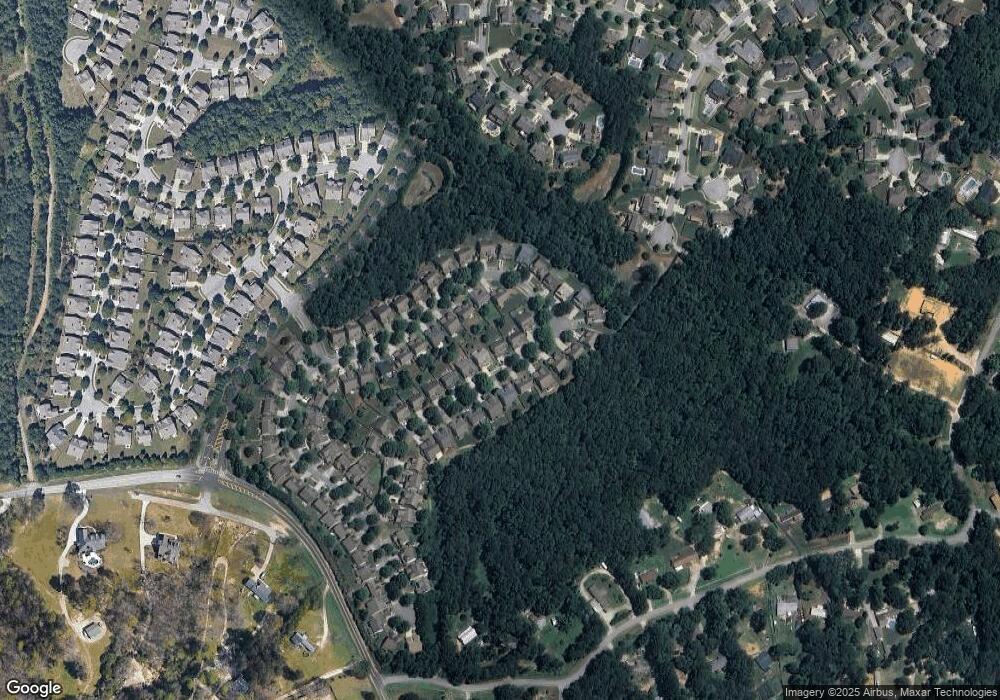
Map
Nearby Homes
- 7835 Keepsake Ln
- 7812 Keepsake Ln
- 7712 Soaring Eagle Dr
- 7804 Keepsake Ln
- 7744 Soaring Eagle Dr
- 7719 Copper Kettle Way
- 7633 Legacy Rd
- 6223 Clearbrook Dr
- 7046 Lancaster Crossing
- 7113 Artisans Way
- 7053 Manchester Dr
- 7048 Manchester Dr
- 7049 Manchester Dr
- 7044 Manchester Dr
- 7043 Lancaster Crossing
- 7041 Manchester Dr
- 7851 Keepsake Ln
- 7843 Keepsake Ln
- 7839 Keepsake Ln Unit 72
- 7863 Keepsake Ln
- 7899 Keepsake Ln
- 7895 Keepsake Ln
- 7903 Keepsake Ln
- 7883 Keepsake Ln
- 7844 Keepsake Ln
- 7840 Keepsake Ln
- 7848 Keepsake Ln
- 7852 Keepsake Ln
- 7911 Keepsake Ln
- 7831 Keepsake Ln
- 7832 Keepsake Ln
- 7872 Keepsake Ln
- 7880 Keepsake Ln
- 7915 Keepsake Ln
- 7904 Keepsake Ln Unit 50
- 7904 Keepsake Ln