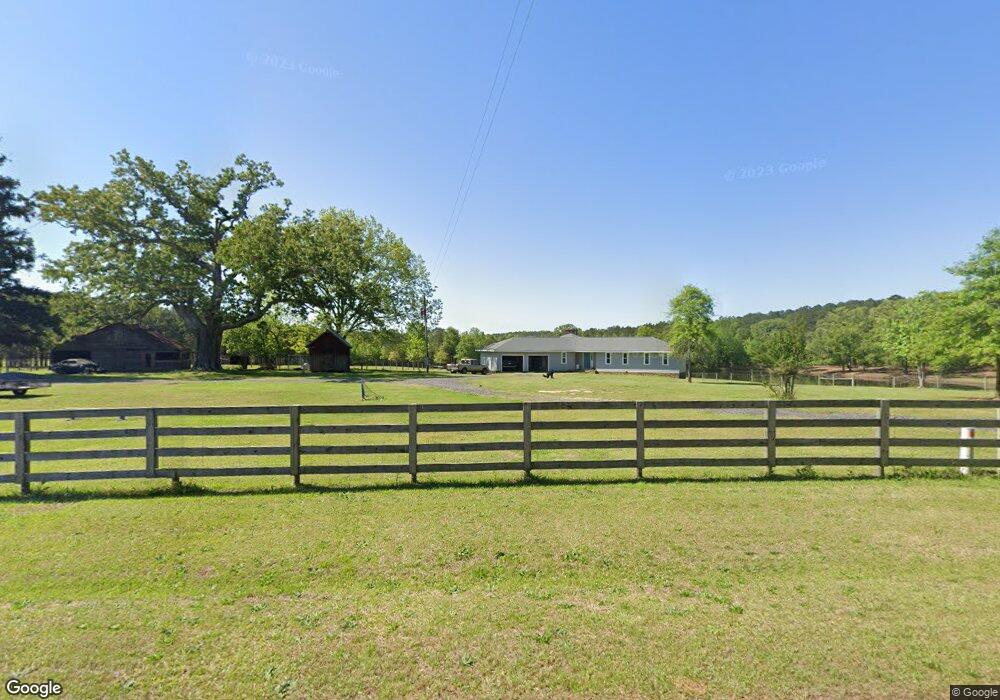
785 Barker Rd Thomaston, GA 30286
Estimated Value: $255,652 - $314,000
3
Beds
2
Baths
1,824
Sq Ft
$155/Sq Ft
Est. Value
About This Home
This home is located at 785 Barker Rd, Thomaston, GA 30286 and is currently estimated at $281,913, approximately $154 per square foot. 785 Barker Rd is a home located in Upson County with nearby schools including Upson-Lee South Elementary School, Upson-Lee North Elementary School, and Upson-Lee Middle School.
Ownership History
Date
Name
Owned For
Owner Type
Purchase Details
Closed on
Jan 18, 2022
Sold by
Harper Steven J
Bought by
Berryhill Benjamin Tyler and Berryhill Lauren Helms
Current Estimated Value
Home Financials for this Owner
Home Financials are based on the most recent Mortgage that was taken out on this home.
Original Mortgage
$163,875
Outstanding Balance
$127,083
Interest Rate
2.62%
Mortgage Type
Cash
Estimated Equity
$154,830
Purchase Details
Closed on
Nov 23, 2015
Sold by
Lee Jeffery Joseph
Bought by
Harper Steven J
Home Financials for this Owner
Home Financials are based on the most recent Mortgage that was taken out on this home.
Original Mortgage
$115,067
Interest Rate
3.83%
Mortgage Type
New Conventional
Purchase Details
Closed on
Oct 31, 2011
Sold by
Kent Blanche Ferguson
Bought by
Lee Jeffery J
Create a Home Valuation Report for This Property
The Home Valuation Report is an in-depth analysis detailing your home's value as well as a comparison with similar homes in the area
Purchase History
| Date | Buyer | Sale Price | Title Company |
|---|---|---|---|
| Berryhill Benjamin Tyler | $172,500 | -- | |
| Harper Steven J | $150,000 | -- | |
| Lee Jeffery J | $140,000 | -- | |
| Lee Jeffery J | $140,000 | -- |
Source: Public Records
Mortgage History
| Date | Status | Borrower | Loan Amount |
|---|---|---|---|
| Open | Berryhill Benjamin Tyler | $163,875 | |
| Previous Owner | Harper Steven J | $115,067 |
Source: Public Records
Tax History
| Year | Tax Paid | Tax Assessment Tax Assessment Total Assessment is a certain percentage of the fair market value that is determined by local assessors to be the total taxable value of land and additions on the property. | Land | Improvement |
|---|---|---|---|---|
| 2025 | $2,044 | $85,692 | $11,280 | $74,412 |
| 2024 | $2,044 | $81,994 | $9,400 | $72,594 |
| 2023 | $2,022 | $78,581 | $9,400 | $69,181 |
| 2022 | $1,277 | $46,063 | $4,005 | $42,058 |
| 2021 | $1,137 | $55,550 | $18,910 | $36,640 |
| 2020 | $1,164 | $60,583 | $25,657 | $34,926 |
| 2019 | $1,175 | $58,013 | $25,657 | $32,356 |
| 2018 | $1,176 | $58,013 | $25,657 | $32,356 |
| 2017 | $1,134 | $53,561 | $25,657 | $27,904 |
| 2016 | $1,089 | $52,798 | $27,371 | $25,427 |
| 2015 | $1,015 | $52,798 | $27,371 | $25,427 |
| 2014 | $1,010 | $73,464 | $48,037 | $25,427 |
Source: Public Records
Map
Nearby Homes
- 120 Ellerbee Lake Rd
- 101 Alexandria Way
- 2621 S Old Alabama Rd
- 3241 Crest Hwy
- 28 Beverly Ln
- 168 Shadow Wood Ln
- 18 Ridgecrest Dr
- 0 Crest Hwy Unit 10563363
- 0 Crest Hwy Unit 10563371
- 2971 Crest Hwy
- 0 Firetower Rd Unit 10689749
- 00 Hebron Church Rd
- 410 Irvin Rd
- 0 Barouche Dr Unit 10597016
- 121 Pickard Rd
- 36 ACRES Firetower Rd
- 5440 Crest Hwy
- 575 Skelton Rd
- 5450 Crest Hwy
- 686 Burkett Rd
- 822 Barker Rd
- 727 Barker Rd
- 615 Hickman Fork Rd
- 588 Hickman Fork Rd
- 915 Barker Rd
- 931 Barker Rd
- 644 Hickman Fork Rd
- 937 Barker Rd
- 703 Hickman Fork Rd
- 389 Hickman Fork Rd
- 565 Barker Rd
- 537 Barker Rd
- 515 Barker Rd
- 730 Hickman Fork Rd
- 795 Hickman Fork Rd
- 831 Hickman Fork Rd
- 440 Barker Rd
- 827 Hickman Fork Rd
- 509 Roland Rd
- 701 Barker Rd
Your Personal Tour Guide
Ask me questions while you tour the home.