Estimated Value: $581,000 - $623,000
--
Bed
--
Bath
2,720
Sq Ft
$222/Sq Ft
Est. Value
About This Home
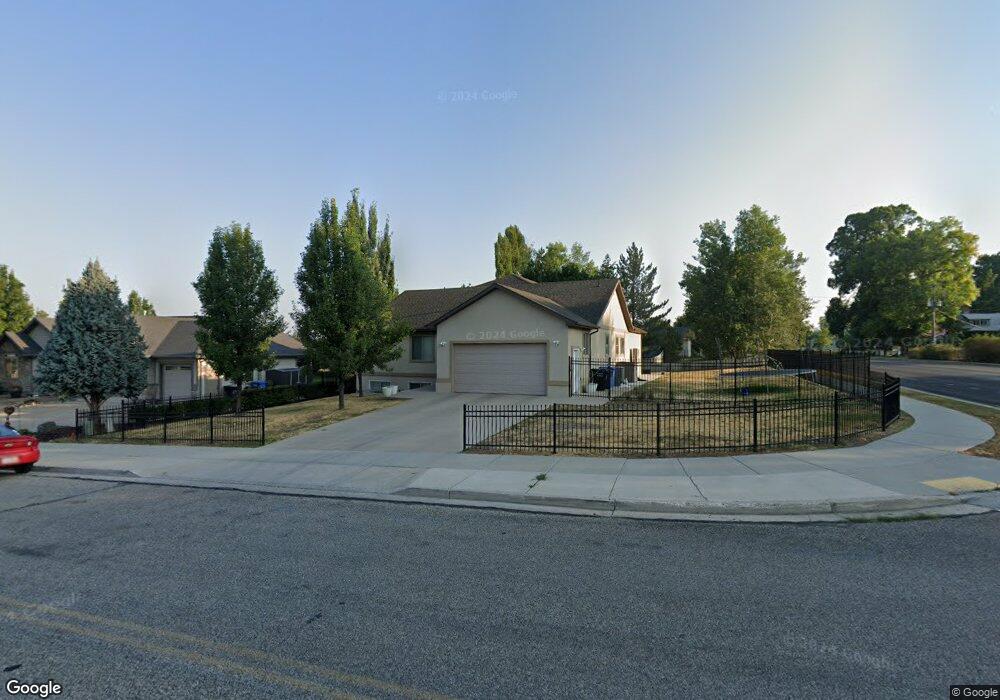
This home is located at 785 E 2100 N, Logan, UT 84341 and is currently estimated at $605,106, approximately $222 per square foot. 785 E 2100 N is a home with nearby schools including Greenville School, Cedar Ridge School, and Cedar Ridge Middle School.
Ownership History
Date
Name
Owned For
Owner Type
Purchase Details
Closed on
Jul 1, 2019
Sold by
Crookston Christopher L and Crookston Maria N
Bought by
Crookston Maria N
Current Estimated Value
Home Financials for this Owner
Home Financials are based on the most recent Mortgage that was taken out on this home.
Original Mortgage
$207,000
Outstanding Balance
$157,550
Interest Rate
4%
Mortgage Type
New Conventional
Estimated Equity
$447,556
Purchase Details
Closed on
Feb 26, 2007
Sold by
Greyeye Enterprises Inc
Bought by
Crookston Christopher L and Crookston Maria N
Home Financials for this Owner
Home Financials are based on the most recent Mortgage that was taken out on this home.
Original Mortgage
$160,000
Interest Rate
6.21%
Mortgage Type
Construction
Create a Home Valuation Report for This Property
The Home Valuation Report is an in-depth analysis detailing your home's value as well as a comparison with similar homes in the area
Home Values in the Area
Average Home Value in this Area
Purchase History
| Date | Buyer | Sale Price | Title Company |
|---|---|---|---|
| Crookston Maria N | -- | Northern Title Company | |
| Crookston Christopher L | -- | American Secure Title |
Source: Public Records
Mortgage History
| Date | Status | Borrower | Loan Amount |
|---|---|---|---|
| Open | Crookston Maria N | $207,000 | |
| Closed | Crookston Christopher L | $160,000 |
Source: Public Records
Tax History Compared to Growth
Tax History
| Year | Tax Paid | Tax Assessment Tax Assessment Total Assessment is a certain percentage of the fair market value that is determined by local assessors to be the total taxable value of land and additions on the property. | Land | Improvement |
|---|---|---|---|---|
| 2025 | $2,746 | $384,390 | $0 | $0 |
| 2024 | $2,669 | $347,710 | $0 | $0 |
| 2023 | $2,559 | $311,960 | $0 | $0 |
| 2022 | $2,678 | $311,960 | $0 | $0 |
| 2021 | $2,120 | $382,798 | $85,000 | $297,798 |
| 2020 | $2,031 | $343,955 | $85,000 | $258,955 |
| 2019 | $2,127 | $343,955 | $85,000 | $258,955 |
| 2018 | $1,889 | $296,210 | $65,000 | $231,210 |
| 2017 | $1,901 | $156,860 | $0 | $0 |
| 2016 | $1,930 | $130,190 | $0 | $0 |
| 2015 | $1,608 | $130,190 | $0 | $0 |
| 2014 | $1,570 | $130,190 | $0 | $0 |
| 2013 | -- | $126,615 | $0 | $0 |
Source: Public Records
Map
Nearby Homes
- 2143 N 950 E
- 2284 N 740 E
- 1963 N 1000 E
- 1593 N 110 W Unit 201
- 611 E 2450 N Unit 1
- 1593 N 110 W Unit 202
- 1593 N 110 W Unit 204
- 1593 N 110 W Unit 203
- 1200 W 1400 N
- 2950 N Mahogony Valley Rd E Unit 7
- 1598 N Sharptail Cir
- 1000 W 2500 N
- Somerley Plan at Smiling H Ranch
- Viewside Plan at Smiling H Ranch
- Willow Plan at Smiling H Ranch
- Northfield Plan at Smiling H Ranch
- Westbrook Plan at Smiling H Ranch
- Hamilton Plan at Smiling H Ranch
- Foxhill Plan at Smiling H Ranch
- Chamberlain Plan at Smiling H Ranch