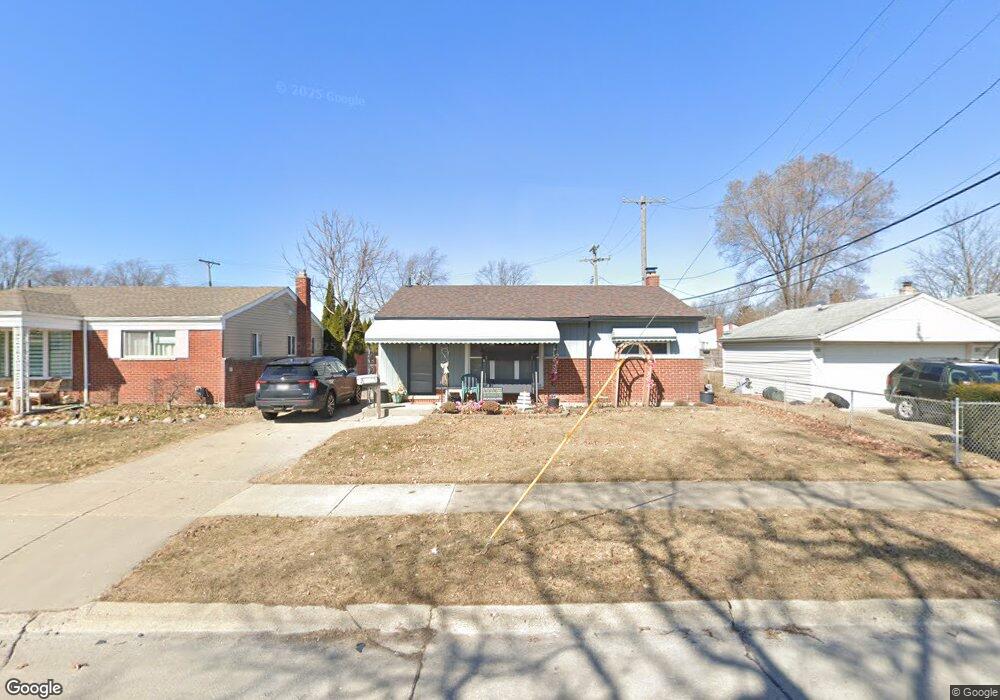
785 E Farnum Ave Madison Heights, MI 48071
Estimated Value: $229,000 - $249,000
3
Beds
2
Baths
1,208
Sq Ft
$198/Sq Ft
Est. Value
About This Home
This home is located at 785 E Farnum Ave, Madison Heights, MI 48071 and is currently estimated at $238,998, approximately $197 per square foot. 785 E Farnum Ave is a home located in Oakland County with nearby schools including Madison High School, Four Corners Montessori Academy, and Keys Grace Academy.
Ownership History
Date
Name
Owned For
Owner Type
Purchase Details
Closed on
Apr 20, 2010
Sold by
Hilla John D and Hilla Tamara L
Bought by
Federal Home Loan Mortgage Corp
Current Estimated Value
Purchase Details
Closed on
Jun 29, 2009
Sold by
Hilla John D and Hilla Tamara L
Bought by
Hilla John D
Purchase Details
Closed on
Feb 28, 2005
Sold by
Fannie Mae
Bought by
Hilla John D and Hilla Tamara L
Purchase Details
Closed on
Apr 19, 2004
Sold by
Mortgage Electronic Registration Systems
Bought by
Federal National Mortgage Association
Purchase Details
Closed on
Apr 13, 2004
Sold by
Ruggles Lisa
Bought by
Mortgage Electronic Registration Systems
Purchase Details
Closed on
Mar 31, 1995
Sold by
Rolain Mark A
Bought by
Ruggles Lisa
Home Financials for this Owner
Home Financials are based on the most recent Mortgage that was taken out on this home.
Original Mortgage
$70,800
Interest Rate
8.55%
Mortgage Type
New Conventional
Create a Home Valuation Report for This Property
The Home Valuation Report is an in-depth analysis detailing your home's value as well as a comparison with similar homes in the area
Home Values in the Area
Average Home Value in this Area
Purchase History
| Date | Buyer | Sale Price | Title Company |
|---|---|---|---|
| Federal Home Loan Mortgage Corp | $155,839 | None Available | |
| Hilla John D | -- | None Available | |
| Hilla John D | $139,900 | -- | |
| Federal National Mortgage Association | -- | -- | |
| Mortgage Electronic Registration Systems | $121,497 | -- | |
| Ruggles Lisa | $88,500 | -- |
Source: Public Records
Mortgage History
| Date | Status | Borrower | Loan Amount |
|---|---|---|---|
| Previous Owner | Ruggles Lisa | $70,800 |
Source: Public Records
Tax History Compared to Growth
Tax History
| Year | Tax Paid | Tax Assessment Tax Assessment Total Assessment is a certain percentage of the fair market value that is determined by local assessors to be the total taxable value of land and additions on the property. | Land | Improvement |
|---|---|---|---|---|
| 2024 | $1,820 | $99,470 | $0 | $0 |
| 2023 | $1,737 | $89,560 | $0 | $0 |
| 2022 | $1,823 | $80,560 | $0 | $0 |
| 2021 | $1,777 | $73,710 | $0 | $0 |
| 2020 | $1,686 | $69,860 | $0 | $0 |
| 2019 | $1,828 | $63,800 | $0 | $0 |
| 2018 | $1,803 | $51,130 | $0 | $0 |
| 2017 | $1,749 | $51,130 | $0 | $0 |
| 2016 | $1,659 | $45,840 | $0 | $0 |
| 2015 | -- | $39,690 | $0 | $0 |
| 2014 | -- | $34,260 | $0 | $0 |
| 2011 | -- | $41,770 | $0 | $0 |
Source: Public Records
Map
Nearby Homes
- 27869 Osmun St
- 27441 Delton St
- 338 Sonia Ave
- 27129 Osmun St
- 27304 Delton St
- 27425 Townley St
- 27824 Groveland St
- 27828 Groveland St
- 27365 Park Ct
- 247 Hecht Dr
- 27328 Park Ct
- 26806 Wolverine St
- 1257 Jerry Ave
- 242 E Parker Ave
- 26636 Wolverine St
- 1285 Jenifer Ave
- 27135 Brush St
- 936 E Katherine Ave
- 28641 Denise St
- 27121 Brush St
- 27605 Rialto St
- 27615 Rialto St
- 775 E Farnum Ave
- 27625 Rialto St
- 765 E Farnum Ave
- 27746 Goldin Dr
- 755 E Farnum Ave
- 27756 Goldin Dr
- 27614 Rialto St
- 27604 Rialto St
- 745 E Farnum Ave
- 27624 Rialto St
- 735 E Farnum Ave
- 27760 Goldin Dr
- 27737 Goldin Dr
- 27717 Goldin Dr
- 27727 Goldin Dr
- 27707 Goldin Dr
- 27734 Rialto St
- 907 E Farnum Ave