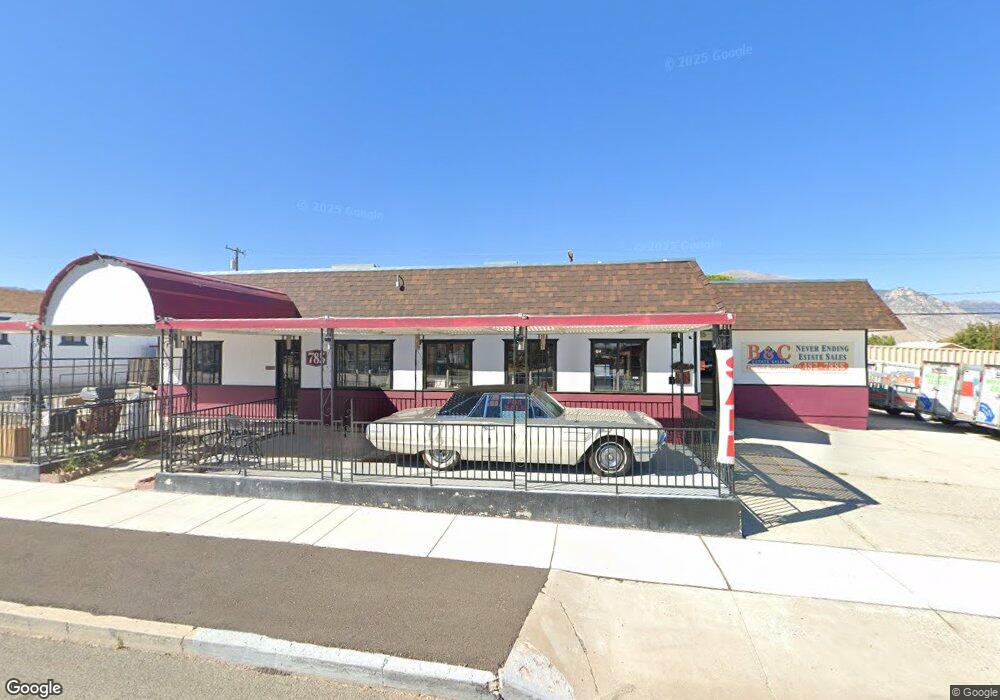
785 E Main St Hawthorne, NV 89415
Estimated Value: $2,233,240
Studio
--
Bath
4,478
Sq Ft
$499/Sq Ft
Est. Value
About This Home
This home is located at 785 E Main St, Hawthorne, NV 89415 and is currently estimated at $2,233,240, approximately $498 per square foot. 785 E Main St is a home located in Mineral County with nearby schools including Mineral County High School.
Ownership History
Date
Name
Owned For
Owner Type
Purchase Details
Closed on
Jul 1, 2021
Sold by
Financial Horizons Cu
Bought by
Johnson Brian
Current Estimated Value
Home Financials for this Owner
Home Financials are based on the most recent Mortgage that was taken out on this home.
Original Mortgage
$120,000
Interest Rate
2.8%
Mortgage Type
Seller Take Back
Purchase Details
Closed on
Feb 26, 2019
Sold by
Wesley Lattin
Bought by
Financial Horizons Cu
Create a Home Valuation Report for This Property
The Home Valuation Report is an in-depth analysis detailing your home's value as well as a comparison with similar homes in the area
Home Values in the Area
Average Home Value in this Area
Purchase History
| Date | Buyer | Sale Price | Title Company |
|---|---|---|---|
| Johnson Brian | $300,000 | Stewart Title | |
| Financial Horizons Cu | -- | -- |
Source: Public Records
Mortgage History
| Date | Status | Borrower | Loan Amount |
|---|---|---|---|
| Previous Owner | Johnson Brian | $120,000 |
Source: Public Records
Tax History
| Year | Tax Paid | Tax Assessment Tax Assessment Total Assessment is a certain percentage of the fair market value that is determined by local assessors to be the total taxable value of land and additions on the property. | Land | Improvement |
|---|---|---|---|---|
| 2025 | $5,480 | $133,358 | $19,940 | $113,418 |
| 2024 | $5,480 | $138,589 | $19,940 | $118,649 |
| 2023 | $5,480 | $134,737 | $19,940 | $114,797 |
| 2022 | $5,330 | $136,124 | $19,940 | $116,184 |
| 2021 | $5,104 | $136,725 | $19,940 | $116,785 |
| 2020 | $5,950 | $137,329 | $19,940 | $117,389 |
| 2019 | $5,798 | $133,442 | $19,940 | $113,502 |
| 2018 | $5,600 | $128,037 | $19,940 | $108,097 |
| 2017 | $5,523 | $125,917 | $19,940 | $105,977 |
| 2016 | $5,303 | $123,839 | $19,940 | $103,899 |
| 2015 | -- | $122,810 | $19,940 | $102,870 |
| 2014 | -- | $122,813 | $19,940 | $102,873 |
Source: Public Records
Map
Nearby Homes
Your Personal Tour Guide
Ask me questions while you tour the home.