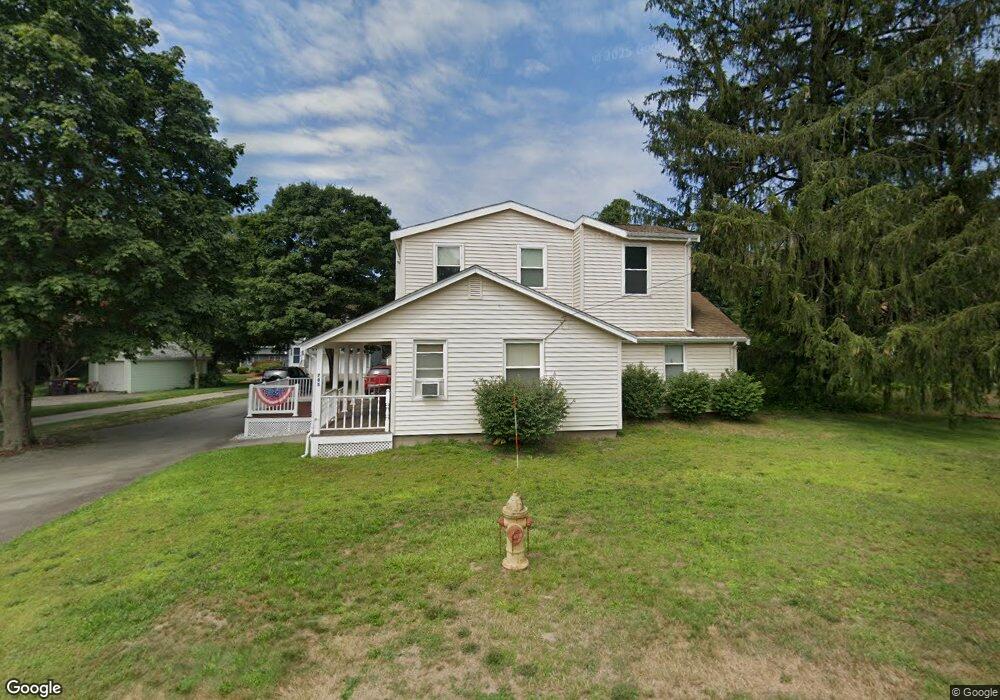
785 Front St Weymouth, MA 02188
South Weymouth NeighborhoodEstimated Value: $668,324 - $748,000
3
Beds
2
Baths
1,947
Sq Ft
$368/Sq Ft
Est. Value
About This Home
This home is located at 785 Front St, Weymouth, MA 02188 and is currently estimated at $717,081, approximately $368 per square foot. 785 Front St is a home located in Norfolk County with nearby schools including Thomas V Nash, Abigail Adams Middle School, and Weymouth Middle School Chapman.
Ownership History
Date
Name
Owned For
Owner Type
Purchase Details
Closed on
Dec 1, 1988
Sold by
Swain Kathleen L
Bought by
Swain Richard J
Current Estimated Value
Home Financials for this Owner
Home Financials are based on the most recent Mortgage that was taken out on this home.
Original Mortgage
$112,300
Interest Rate
10.19%
Mortgage Type
Purchase Money Mortgage
Create a Home Valuation Report for This Property
The Home Valuation Report is an in-depth analysis detailing your home's value as well as a comparison with similar homes in the area
Home Values in the Area
Average Home Value in this Area
Purchase History
| Date | Buyer | Sale Price | Title Company |
|---|---|---|---|
| Swain Richard J | $142,000 | -- |
Source: Public Records
Mortgage History
| Date | Status | Borrower | Loan Amount |
|---|---|---|---|
| Open | Swain Richard J | $25,000 | |
| Closed | Swain Richard J | $112,300 |
Source: Public Records
Tax History Compared to Growth
Tax History
| Year | Tax Paid | Tax Assessment Tax Assessment Total Assessment is a certain percentage of the fair market value that is determined by local assessors to be the total taxable value of land and additions on the property. | Land | Improvement |
|---|---|---|---|---|
| 2025 | $5,475 | $542,100 | $229,100 | $313,000 |
| 2024 | $5,303 | $516,400 | $218,200 | $298,200 |
| 2023 | $5,118 | $489,800 | $202,000 | $287,800 |
| 2022 | $4,993 | $435,700 | $187,100 | $248,600 |
| 2021 | $4,751 | $404,700 | $187,100 | $217,600 |
| 2020 | $4,617 | $387,300 | $187,100 | $200,200 |
| 2019 | $4,545 | $375,000 | $179,900 | $195,100 |
| 2018 | $4,480 | $358,400 | $171,300 | $187,100 |
| 2017 | $4,203 | $328,100 | $163,200 | $164,900 |
| 2016 | $4,106 | $320,800 | $156,900 | $163,900 |
| 2015 | $3,949 | $306,100 | $156,900 | $149,200 |
| 2014 | $3,783 | $284,400 | $146,000 | $138,400 |
Source: Public Records
Map
Nearby Homes
- 200 Justin Dr Unit 3
- 116 Belmont St
- 2 Tara Dr Unit 1
- 255 West St
- 262 West St
- 501 Commerce Dr Unit 2310
- 501 Commerce Dr Unit 1111
- 501 Commerce Dr Unit 4206
- 501 Commerce Dr Unit 4308
- 501 Commerce Dr Unit 4306
- 2 Mitchell Ln Unit B
- 92 Mercury St
- 747 Middle St
- 215 Winter St Unit 1P
- 200 Burkhall St Unit 803
- 200 Burkhall St Unit 102
- 191 Tall Oaks Dr Unit C
- 24 Blake Rd
- 27 Park Ave
- 25 Echo Ave