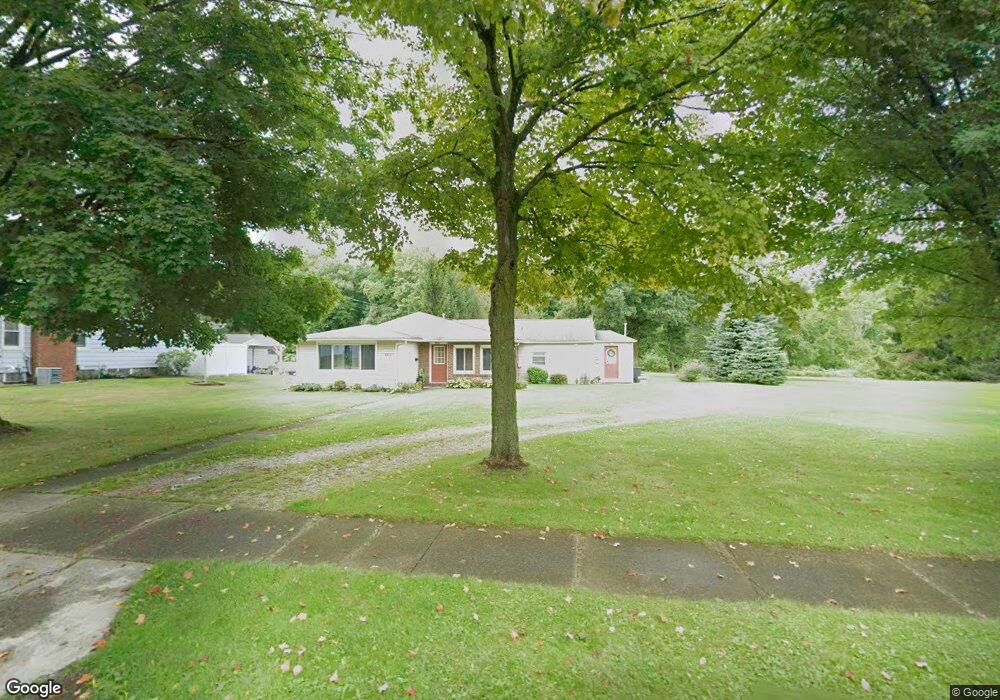
785 Grove St Conneaut, OH 44030
Estimated Value: $111,000 - $185,287
2
Beds
2
Baths
1,956
Sq Ft
$79/Sq Ft
Est. Value
About This Home
This home is located at 785 Grove St, Conneaut, OH 44030 and is currently estimated at $153,822, approximately $78 per square foot. 785 Grove St is a home located in Ashtabula County with nearby schools including Lakeshore Primary Elementary School, Gateway Elementary School, and Conneaut Middle School.
Ownership History
Date
Name
Owned For
Owner Type
Purchase Details
Closed on
Apr 27, 2010
Sold by
Us Bank National Association
Bought by
Stroeter Eugina R
Current Estimated Value
Purchase Details
Closed on
Jan 26, 2010
Sold by
Miracle Mark A
Bought by
Us Bank National Association
Purchase Details
Closed on
Aug 14, 2003
Sold by
Fv-1 Inc
Bought by
Miracle Mark A
Home Financials for this Owner
Home Financials are based on the most recent Mortgage that was taken out on this home.
Original Mortgage
$42,400
Interest Rate
8.4%
Mortgage Type
Purchase Money Mortgage
Purchase Details
Closed on
Apr 10, 2002
Sold by
Equicredit Corp Of America
Bought by
Fv-1 Inc
Purchase Details
Closed on
Apr 1, 2002
Sold by
Shr William P Johnson Pr
Bought by
Equicredit Corp Of America
Create a Home Valuation Report for This Property
The Home Valuation Report is an in-depth analysis detailing your home's value as well as a comparison with similar homes in the area
Home Values in the Area
Average Home Value in this Area
Purchase History
| Date | Buyer | Sale Price | Title Company |
|---|---|---|---|
| Stroeter Eugina R | $42,000 | None Available | |
| Us Bank National Association | $70,000 | None Available | |
| Miracle Mark A | $53,000 | -- | |
| Fv-1 Inc | -- | -- | |
| Equicredit Corp Of America | $40,000 | -- |
Source: Public Records
Mortgage History
| Date | Status | Borrower | Loan Amount |
|---|---|---|---|
| Previous Owner | Miracle Mark A | $42,400 |
Source: Public Records
Tax History Compared to Growth
Tax History
| Year | Tax Paid | Tax Assessment Tax Assessment Total Assessment is a certain percentage of the fair market value that is determined by local assessors to be the total taxable value of land and additions on the property. | Land | Improvement |
|---|---|---|---|---|
| 2024 | $2,978 | $40,710 | $8,540 | $32,170 |
| 2023 | $1,890 | $40,710 | $8,540 | $32,170 |
| 2022 | $1,605 | $30,420 | $6,580 | $23,840 |
| 2021 | $1,633 | $30,420 | $6,580 | $23,840 |
| 2020 | $1,632 | $30,420 | $6,580 | $23,840 |
| 2019 | $1,635 | $29,930 | $6,300 | $23,630 |
| 2018 | $1,559 | $29,930 | $6,300 | $23,630 |
| 2017 | $1,289 | $29,930 | $6,300 | $23,630 |
| 2016 | $1,380 | $28,910 | $6,090 | $22,820 |
| 2015 | $2,727 | $28,910 | $6,090 | $22,820 |
| 2014 | $2,689 | $28,910 | $6,090 | $22,820 |
| 2013 | $2,735 | $32,830 | $5,670 | $27,160 |
Source: Public Records
Map
Nearby Homes