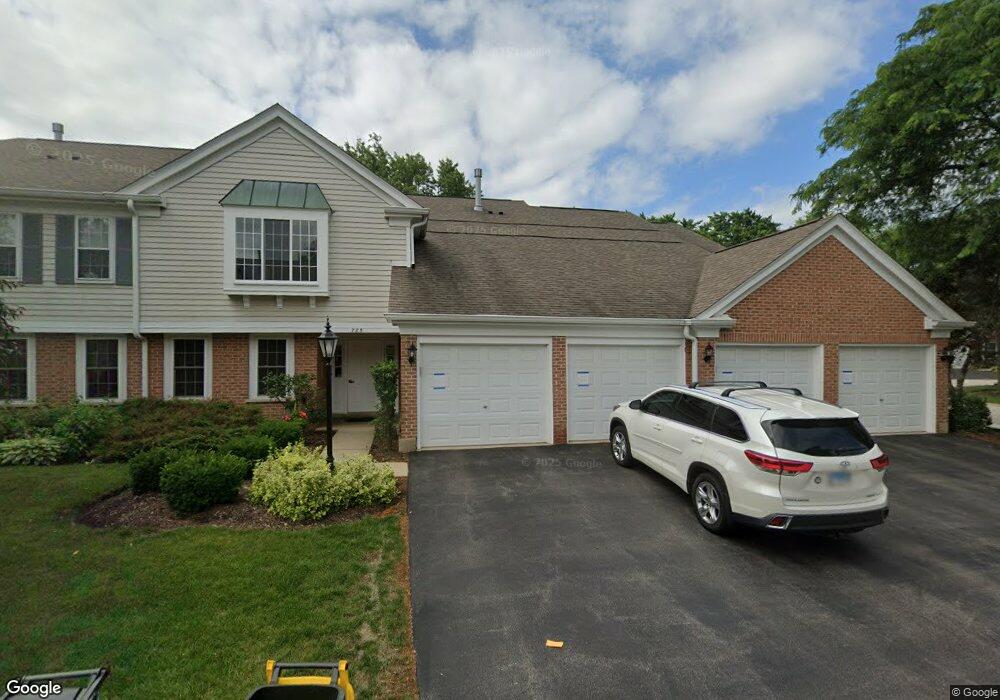
785 Margate Ln Unit 12195 Prospect Heights, IL 60070
Estimated Value: $289,456 - $332,000
2
Beds
--
Bath
1,246
Sq Ft
$256/Sq Ft
Est. Value
About This Home
This home is located at 785 Margate Ln Unit 12195, Prospect Heights, IL 60070 and is currently estimated at $318,864, approximately $255 per square foot. 785 Margate Ln Unit 12195 is a home located in Cook County with nearby schools including Euclid Elementary School, River Trails Middle School, and John Hersey High School.
Ownership History
Date
Name
Owned For
Owner Type
Purchase Details
Closed on
Jun 30, 2006
Sold by
Faso Gina M
Bought by
Choy Cymen M
Current Estimated Value
Home Financials for this Owner
Home Financials are based on the most recent Mortgage that was taken out on this home.
Original Mortgage
$203,200
Outstanding Balance
$121,167
Interest Rate
6.73%
Mortgage Type
New Conventional
Estimated Equity
$197,697
Purchase Details
Closed on
Aug 11, 2000
Sold by
Derenski Carole S and Carole S Derenski Trust
Bought by
Faso Gina M
Home Financials for this Owner
Home Financials are based on the most recent Mortgage that was taken out on this home.
Original Mortgage
$157,400
Interest Rate
7.91%
Purchase Details
Closed on
Dec 7, 1999
Sold by
Derenski Carole S
Bought by
Derenski Carole S and Carole S Derenski Trust
Purchase Details
Closed on
Oct 10, 1997
Sold by
Derenski Robert S and Derenski Carole S
Bought by
Derenski Carole S
Create a Home Valuation Report for This Property
The Home Valuation Report is an in-depth analysis detailing your home's value as well as a comparison with similar homes in the area
Home Values in the Area
Average Home Value in this Area
Purchase History
| Date | Buyer | Sale Price | Title Company |
|---|---|---|---|
| Choy Cymen M | $254,000 | Pntn | |
| Faso Gina M | $174,900 | Professional National Title | |
| Derenski Carole S | -- | -- | |
| Derenski Carole S | -- | -- |
Source: Public Records
Mortgage History
| Date | Status | Borrower | Loan Amount |
|---|---|---|---|
| Open | Choy Cymen M | $203,200 | |
| Previous Owner | Faso Gina M | $157,400 |
Source: Public Records
Tax History Compared to Growth
Tax History
| Year | Tax Paid | Tax Assessment Tax Assessment Total Assessment is a certain percentage of the fair market value that is determined by local assessors to be the total taxable value of land and additions on the property. | Land | Improvement |
|---|---|---|---|---|
| 2024 | $5,295 | $19,910 | $1,793 | $18,117 |
| 2023 | $4,937 | $19,910 | $1,793 | $18,117 |
| 2022 | $4,937 | $19,910 | $1,793 | $18,117 |
| 2021 | $4,538 | $16,476 | $560 | $15,916 |
| 2020 | $4,434 | $16,476 | $560 | $15,916 |
| 2019 | $4,469 | $18,457 | $560 | $17,897 |
| 2018 | $3,940 | $15,433 | $448 | $14,985 |
| 2017 | $3,906 | $15,433 | $448 | $14,985 |
| 2016 | $3,909 | $15,433 | $448 | $14,985 |
| 2015 | $3,558 | $13,454 | $896 | $12,558 |
| 2014 | $3,536 | $13,454 | $896 | $12,558 |
| 2013 | $3,433 | $13,454 | $896 | $12,558 |
Source: Public Records
Map
Nearby Homes
- 212 Country Club Dr Unit 198
- 688 Glasgow Ln Unit 121133
- 763 Sussex Corner Ln Unit 15
- 603 Thistle Ln Unit 16185
- 509 Aberdeen Ln Unit C
- 501 Aberdeen Ln Unit C
- 203 Coldren Dr
- 354 Country Club Dr
- 1116 N Westgate Rd
- 703 Newcastle Ln
- 1214 N Crabtree Ln
- 1121 N Greenfield Ln
- 302 Lonsdale Rd
- 1205 E Camp Mcdonald Rd
- 206 E Camp Mcdonald Rd
- 1008 N Newberry Ln
- 1000 N Westgate Rd
- 1622 E Greenwood Dr
- 300 E Marion Ave
- 1136 N Boxwood Dr
- 785 Margate Ln Unit A
- 785 Margate Ln Unit 12195
- 785 Margate Ln Unit C
- 785 Margate Ln Unit 12195
- 785 Margate Ln Unit D
- 793 Margate Ln Unit 12195L
- 793 Margate Ln Unit 12195L
- 793 Margate Ln Unit 12195
- 793 Margate Ln Unit 12195L
- 793 Margate Ln Unit A
- 784 Margate Ln Unit 12298
- 784 Margate Ln Unit 12298
- 784 Margate Ln Unit 12298
- 784 Margate Ln Unit 12298
- 784 Margate Ln Unit C
- 784 Margate Ln Unit D
- 792 Margate Ln Unit 12298
- 792 Margate Ln Unit 12298
- 792 Margate Ln Unit 12298
- 792 Margate Ln Unit C