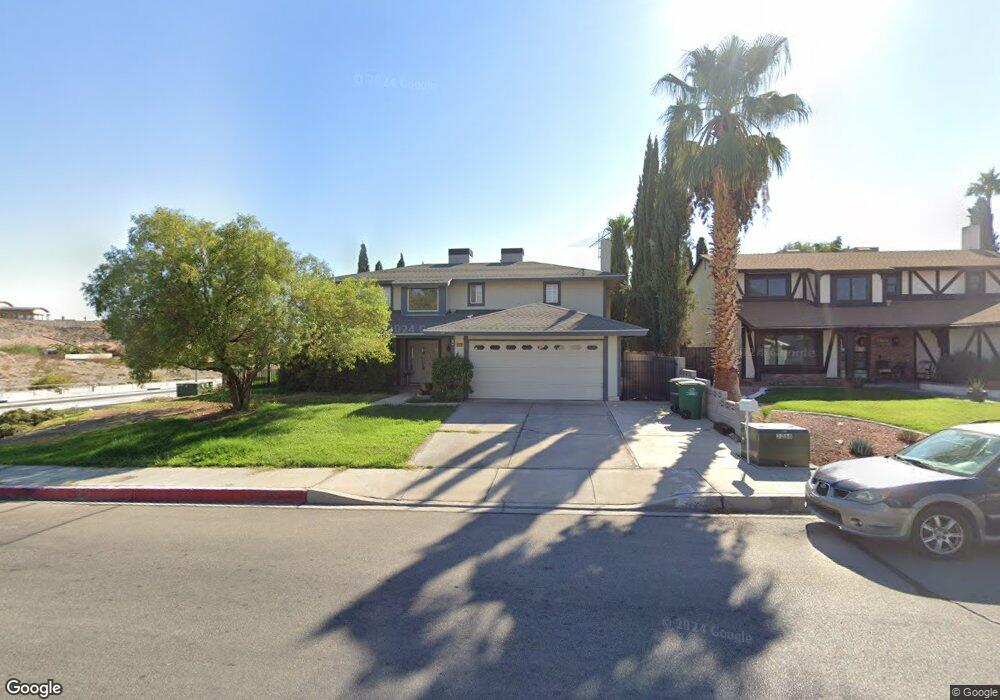
785 Marita Dr Boulder City, NV 89005
Estimated Value: $584,000 - $594,000
4
Beds
3
Baths
2,174
Sq Ft
$270/Sq Ft
Est. Value
About This Home
This home is located at 785 Marita Dr, Boulder City, NV 89005 and is currently estimated at $587,383, approximately $270 per square foot. 785 Marita Dr is a home located in Clark County with nearby schools including Andrew Mitchell Elementary School, Martha P. King Elementary School, and Elton M. & Madelaine E. Garrett Junior High School.
Ownership History
Date
Name
Owned For
Owner Type
Purchase Details
Closed on
Jul 20, 2007
Sold by
Northup Dale E and Northup Linda M
Bought by
Wong Alice
Current Estimated Value
Home Financials for this Owner
Home Financials are based on the most recent Mortgage that was taken out on this home.
Original Mortgage
$297,500
Outstanding Balance
$186,045
Interest Rate
6.51%
Mortgage Type
Unknown
Estimated Equity
$401,338
Purchase Details
Closed on
Jul 9, 1999
Sold by
Wood Pete and Wood Jackie
Bought by
Northup Dale E and Northup Linda M
Purchase Details
Closed on
Jan 19, 1999
Sold by
Fisher Paul Cary and Fisher Amelia G
Bought by
Wood Pete E and Wood Jacqueline J
Home Financials for this Owner
Home Financials are based on the most recent Mortgage that was taken out on this home.
Original Mortgage
$158,400
Interest Rate
6.63%
Create a Home Valuation Report for This Property
The Home Valuation Report is an in-depth analysis detailing your home's value as well as a comparison with similar homes in the area
Home Values in the Area
Average Home Value in this Area
Purchase History
| Date | Buyer | Sale Price | Title Company |
|---|---|---|---|
| Wong Alice | $425,500 | Chicago Title | |
| Northup Dale E | $99,000 | United Title | |
| Wood Pete E | $198,000 | Land Title |
Source: Public Records
Mortgage History
| Date | Status | Borrower | Loan Amount |
|---|---|---|---|
| Open | Wong Alice | $297,500 | |
| Previous Owner | Wood Pete E | $158,400 |
Source: Public Records
Tax History Compared to Growth
Tax History
| Year | Tax Paid | Tax Assessment Tax Assessment Total Assessment is a certain percentage of the fair market value that is determined by local assessors to be the total taxable value of land and additions on the property. | Land | Improvement |
|---|---|---|---|---|
| 2025 | $2,135 | $103,859 | $51,800 | $52,059 |
| 2024 | $2,073 | $103,859 | $51,800 | $52,059 |
| 2023 | $1,698 | $90,807 | $39,900 | $50,907 |
| 2022 | $2,012 | $82,652 | $35,000 | $47,652 |
| 2021 | $1,954 | $76,506 | $30,450 | $46,056 |
| 2020 | $1,897 | $76,883 | $30,450 | $46,433 |
| 2019 | $1,842 | $72,687 | $26,250 | $46,437 |
| 2018 | $1,788 | $68,469 | $23,100 | $45,369 |
| 2017 | $1,817 | $69,565 | $22,750 | $46,815 |
| 2016 | $1,698 | $68,023 | $20,300 | $47,723 |
| 2015 | $1,695 | $64,840 | $17,500 | $47,340 |
| 2014 | $1,645 | $61,662 | $15,750 | $45,912 |
Source: Public Records
Map
Nearby Homes
- 798 Fairway Dr
- 1546 Georgia Ave
- 1527 Irene Dr
- 893 Fairway Dr
- 782 Sandra Dr
- 1316 Capri Dr Unit A,B,C,&D
- 1321 Nadine Way
- 1413 Pueblo Dr
- 976 El Camino Way
- 1303 Darlene Way Unit 105C
- 1303 Darlene Way Unit 102B
- 1427 San Felipe Dr
- 1000 Legacy Dr
- 1300 Georgia Ave Unit A
- 1010 Legacy Dr
- 839 Benita Place
- 834 Benita Place
- 1437 Cattail Falls St
- 1505 Carlsbad St
- 873 Montera Ln