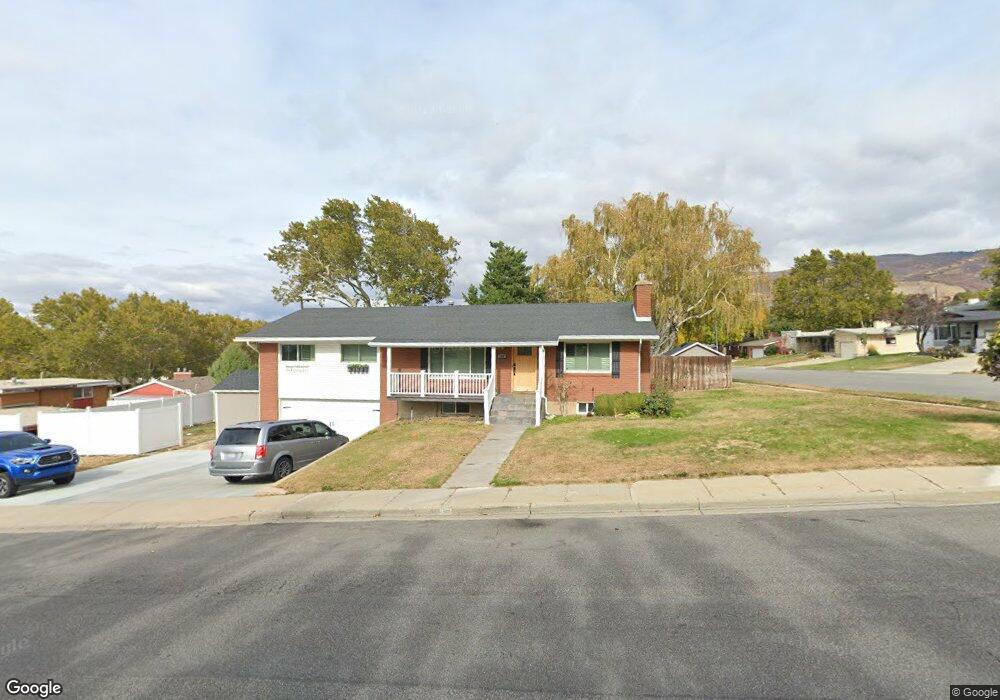
785 Mill St Bountiful, UT 84010
Estimated Value: $582,000 - $741,000
4
Beds
3
Baths
2,552
Sq Ft
$251/Sq Ft
Est. Value
About This Home
This home is located at 785 Mill St, Bountiful, UT 84010 and is currently estimated at $641,512, approximately $251 per square foot. 785 Mill St is a home located in Davis County with nearby schools including Oak Hills School, Millcreek Junior High School, and Bountiful High School.
Ownership History
Date
Name
Owned For
Owner Type
Purchase Details
Closed on
Oct 27, 2023
Sold by
Jones Jasmine Elizabeth and Pereyda Arnoldo
Bought by
Schwab Elizabeth
Current Estimated Value
Home Financials for this Owner
Home Financials are based on the most recent Mortgage that was taken out on this home.
Original Mortgage
$548,213
Outstanding Balance
$537,554
Interest Rate
7.18%
Mortgage Type
Seller Take Back
Estimated Equity
$103,958
Purchase Details
Closed on
Nov 8, 2021
Sold by
Wimmer Valorie H and Wimmer Kirk D
Bought by
Jones Jasmine Elizabeth and Pereyda Arnoldo
Home Financials for this Owner
Home Financials are based on the most recent Mortgage that was taken out on this home.
Original Mortgage
$572,880
Interest Rate
3.01%
Mortgage Type
VA
Purchase Details
Closed on
Mar 4, 1997
Sold by
Wimmer Kirk D and Wimmer Valorie H
Bought by
Wimmer Kirk D and Wimmer Valorie H
Create a Home Valuation Report for This Property
The Home Valuation Report is an in-depth analysis detailing your home's value as well as a comparison with similar homes in the area
Purchase History
| Date | Buyer | Sale Price | Title Company |
|---|---|---|---|
| Schwab Elizabeth | -- | Real Advantage Title | |
| Jones Jasmine Elizabeth | -- | Aspen Title Insurance | |
| Wimmer Kirk D | -- | Associated Title Company |
Source: Public Records
Mortgage History
| Date | Status | Borrower | Loan Amount |
|---|---|---|---|
| Open | Schwab Elizabeth | $548,213 | |
| Previous Owner | Jones Jasmine Elizabeth | $572,880 |
Source: Public Records
Tax History
| Year | Tax Paid | Tax Assessment Tax Assessment Total Assessment is a certain percentage of the fair market value that is determined by local assessors to be the total taxable value of land and additions on the property. | Land | Improvement |
|---|---|---|---|---|
| 2025 | $3,407 | $311,850 | $127,114 | $184,736 |
| 2024 | $3,165 | $299,749 | $114,005 | $185,744 |
| 2023 | $3,127 | $538,000 | $209,382 | $328,618 |
| 2022 | $3,271 | $309,100 | $114,237 | $194,863 |
| 2021 | $2,365 | $337,000 | $149,520 | $187,480 |
| 2020 | $2,082 | $297,000 | $127,482 | $169,518 |
| 2019 | $2,088 | $291,000 | $132,998 | $158,002 |
| 2018 | $1,936 | $265,000 | $130,333 | $134,667 |
| 2016 | $1,734 | $128,920 | $48,712 | $80,208 |
| 2015 | $1,728 | $121,440 | $48,712 | $72,728 |
| 2014 | $1,830 | $128,790 | $48,712 | $80,078 |
| 2013 | -- | $93,451 | $42,903 | $50,548 |
Source: Public Records
Map
Nearby Homes
Your Personal Tour Guide
Ask me questions while you tour the home.