Estimated Value: $359,000 - $392,000
5
Beds
2
Baths
2,199
Sq Ft
$172/Sq Ft
Est. Value
About This Home
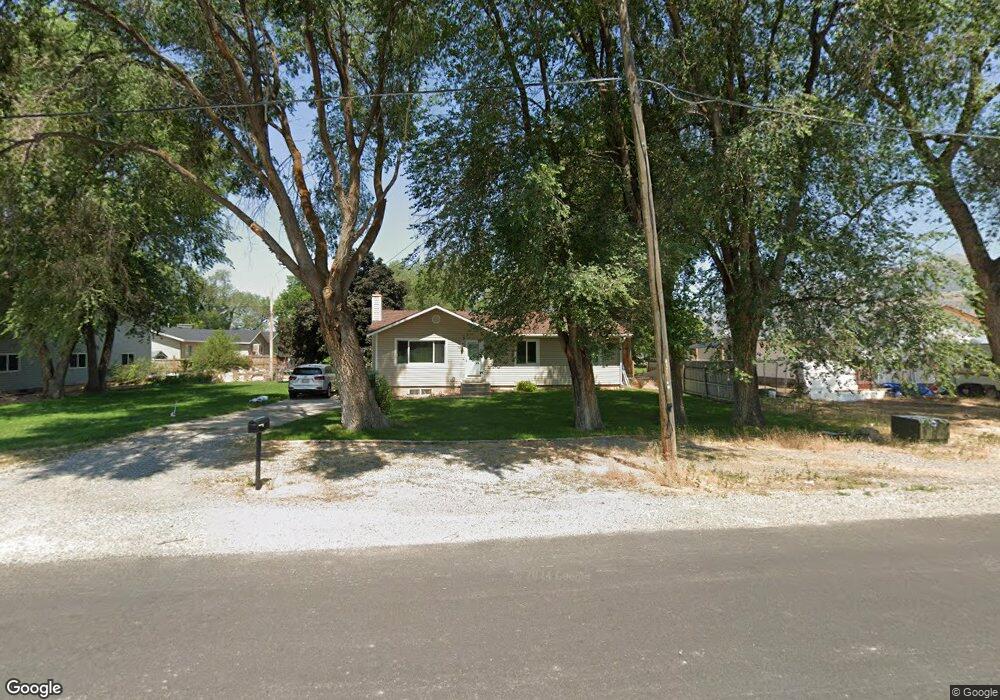
This home is located at 785 Park Dr, Hyrum, UT 84319 and is currently estimated at $377,830, approximately $171 per square foot. 785 Park Dr is a home located in Cache County with nearby schools including Millville School, South Cache Middle School, and Mountain Crest High School.
Ownership History
Date
Name
Owned For
Owner Type
Purchase Details
Closed on
Nov 16, 2018
Sold by
Gunnell Jill
Bought by
Yeates Andrew S and Yeates Ashley L
Current Estimated Value
Home Financials for this Owner
Home Financials are based on the most recent Mortgage that was taken out on this home.
Original Mortgage
$217,979
Outstanding Balance
$192,683
Interest Rate
5.16%
Mortgage Type
FHA
Estimated Equity
$185,147
Purchase Details
Closed on
Jan 9, 2018
Sold by
Gunnell Jeffrey Paul
Bought by
Gunnell Jill
Home Financials for this Owner
Home Financials are based on the most recent Mortgage that was taken out on this home.
Original Mortgage
$80,000
Interest Rate
3.93%
Mortgage Type
New Conventional
Create a Home Valuation Report for This Property
The Home Valuation Report is an in-depth analysis detailing your home's value as well as a comparison with similar homes in the area
Home Values in the Area
Average Home Value in this Area
Purchase History
| Date | Buyer | Sale Price | Title Company |
|---|---|---|---|
| Yeates Andrew S | -- | Inwest Title Services Inc | |
| Gunnell Jill | -- | -- |
Source: Public Records
Mortgage History
| Date | Status | Borrower | Loan Amount |
|---|---|---|---|
| Open | Yeates Andrew S | $217,979 | |
| Previous Owner | Gunnell Jill | $80,000 |
Source: Public Records
Tax History Compared to Growth
Tax History
| Year | Tax Paid | Tax Assessment Tax Assessment Total Assessment is a certain percentage of the fair market value that is determined by local assessors to be the total taxable value of land and additions on the property. | Land | Improvement |
|---|---|---|---|---|
| 2025 | $1,311 | $188,240 | $0 | $0 |
| 2024 | $1,398 | $187,485 | $0 | $0 |
| 2023 | $1,372 | $175,890 | $0 | $0 |
| 2022 | $1,432 | $175,895 | $0 | $0 |
| 2021 | $1,379 | $261,010 | $65,050 | $195,960 |
| 2020 | $1,286 | $228,350 | $65,050 | $163,300 |
| 2019 | $1,016 | $169,763 | $38,000 | $131,763 |
| 2018 | $927 | $149,664 | $38,000 | $111,664 |
| 2017 | $904 | $75,735 | $0 | $0 |
| 2016 | $924 | $75,735 | $0 | $0 |
| 2015 | $926 | $75,735 | $0 | $0 |
| 2014 | $844 | $70,530 | $0 | $0 |
| 2013 | -- | $70,530 | $0 | $0 |
Source: Public Records
Map
Nearby Homes