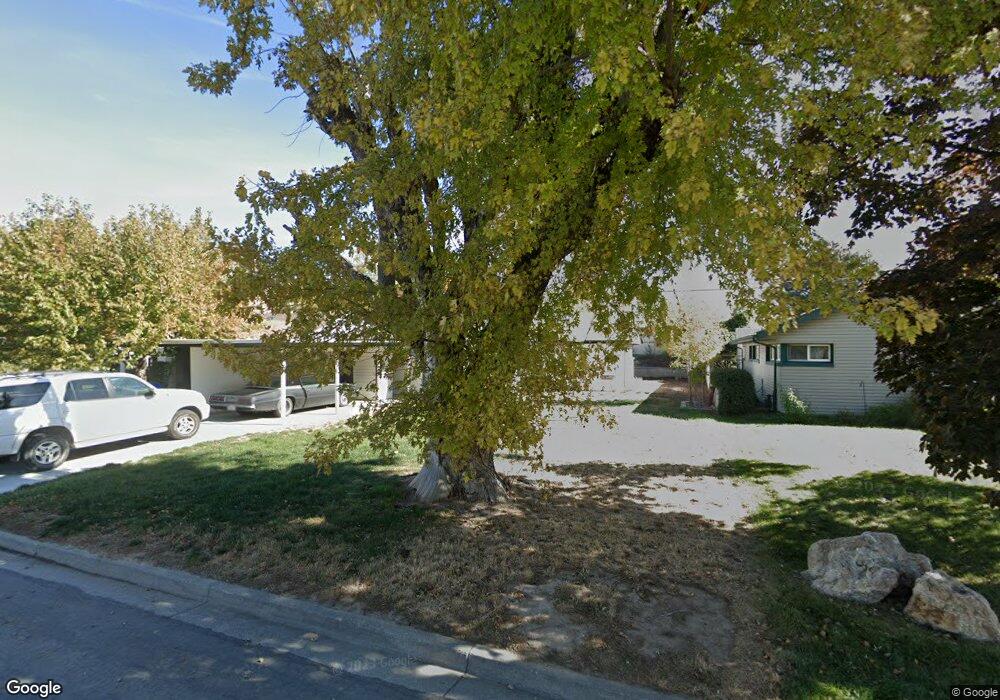
785 S 350 W Bountiful, UT 84010
Estimated Value: $346,000 - $414,662
3
Beds
1
Bath
1,075
Sq Ft
$355/Sq Ft
Est. Value
About This Home
This home is located at 785 S 350 W, Bountiful, UT 84010 and is currently estimated at $381,916, approximately $355 per square foot. 785 S 350 W is a home located in Davis County with nearby schools including Bountiful Elementary School, Millcreek Junior High School, and Bountiful High School.
Ownership History
Date
Name
Owned For
Owner Type
Purchase Details
Closed on
Dec 24, 2019
Sold by
Bost Danny G
Bought by
Jensen Jacob Brent
Current Estimated Value
Home Financials for this Owner
Home Financials are based on the most recent Mortgage that was taken out on this home.
Original Mortgage
$214,051
Outstanding Balance
$187,397
Interest Rate
3.25%
Mortgage Type
FHA
Estimated Equity
$194,519
Purchase Details
Closed on
Jul 18, 2002
Sold by
Minor Paul E
Bought by
Bost Danny G
Home Financials for this Owner
Home Financials are based on the most recent Mortgage that was taken out on this home.
Original Mortgage
$114,207
Interest Rate
6.69%
Mortgage Type
FHA
Purchase Details
Closed on
Sep 23, 1998
Sold by
Martin Joanne C and Martin Charles A
Bought by
Minor Ii Paul E
Home Financials for this Owner
Home Financials are based on the most recent Mortgage that was taken out on this home.
Original Mortgage
$106,514
Interest Rate
6.88%
Mortgage Type
FHA
Create a Home Valuation Report for This Property
The Home Valuation Report is an in-depth analysis detailing your home's value as well as a comparison with similar homes in the area
Purchase History
| Date | Buyer | Sale Price | Title Company |
|---|---|---|---|
| Jensen Jacob Brent | -- | Vanguard Title Ins | |
| Bost Danny G | -- | Equity Title Agency | |
| Minor Ii Paul E | -- | Superior Title Company |
Source: Public Records
Mortgage History
| Date | Status | Borrower | Loan Amount |
|---|---|---|---|
| Open | Jensen Jacob Brent | $214,051 | |
| Previous Owner | Bost Danny G | $114,207 | |
| Previous Owner | Minor Ii Paul E | $106,514 |
Source: Public Records
Tax History
| Year | Tax Paid | Tax Assessment Tax Assessment Total Assessment is a certain percentage of the fair market value that is determined by local assessors to be the total taxable value of land and additions on the property. | Land | Improvement |
|---|---|---|---|---|
| 2025 | $2,237 | $164,450 | $116,437 | $48,013 |
| 2024 | $1,999 | $159,500 | $99,712 | $59,788 |
| 2023 | $1,931 | $278,000 | $187,478 | $90,522 |
| 2022 | $1,993 | $160,600 | $103,475 | $57,125 |
| 2021 | $1,567 | $221,000 | $135,245 | $85,755 |
| 2020 | $1,377 | $194,000 | $116,937 | $77,063 |
| 2019 | $1,546 | $215,000 | $134,090 | $80,910 |
| 2018 | $1,422 | $194,000 | $131,654 | $62,346 |
| 2016 | $1,207 | $89,045 | $51,912 | $37,133 |
| 2015 | $1,174 | $81,675 | $51,912 | $29,763 |
| 2014 | $1,254 | $90,458 | $51,912 | $38,546 |
| 2013 | -- | $84,215 | $36,190 | $48,025 |
Source: Public Records
Map
Nearby Homes
- 360 W 800 S
- 1016 S 400 W
- 990 S 500 W
- 553 Clark St
- 109 W 900 S
- 1314 S 200 W Unit 19
- 1350 S 200 W
- 650 S Main St Unit 9106
- 650 S Main St Unit 6111
- 34 W 400 S
- 32 W 400 S
- 1289 S 675 W
- 545 S 100 E
- 1602 S 550 W
- 75 N Peregrine Ln W Unit 8
- 758 W 1000 S
- 680 W 500 S Unit 17
- 103 S 100 E
- 553 W 1880 S
- 1601 S 700 W
Your Personal Tour Guide
Ask me questions while you tour the home.