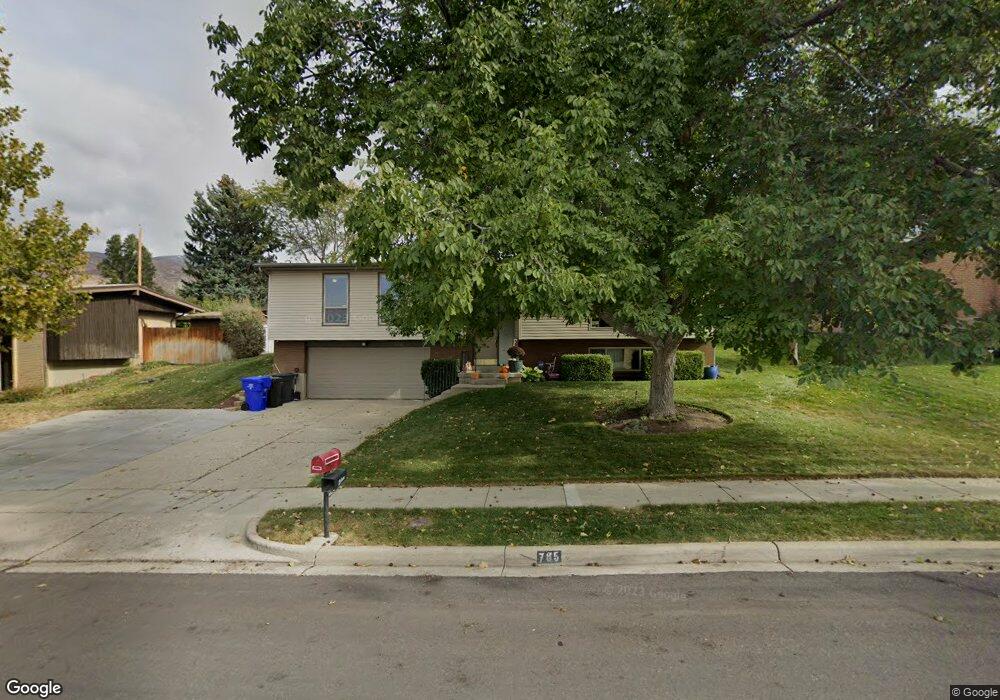
785 S 650 E Bountiful, UT 84010
Estimated Value: $537,000 - $551,000
4
Beds
3
Baths
1,417
Sq Ft
$385/Sq Ft
Est. Value
About This Home
This home is located at 785 S 650 E, Bountiful, UT 84010 and is currently estimated at $545,518, approximately $384 per square foot. 785 S 650 E is a home located in Davis County with nearby schools including Oak Hills School, Millcreek Junior High School, and Bountiful High School.
Ownership History
Date
Name
Owned For
Owner Type
Purchase Details
Closed on
Apr 25, 2006
Sold by
Kilpack Lloyd A and Kilpack Mellanee M
Bought by
Kilpack Joshua A and Kilpack Amy R
Current Estimated Value
Home Financials for this Owner
Home Financials are based on the most recent Mortgage that was taken out on this home.
Original Mortgage
$154,200
Outstanding Balance
$88,255
Interest Rate
6.29%
Mortgage Type
Fannie Mae Freddie Mac
Estimated Equity
$457,263
Purchase Details
Closed on
Jun 17, 2005
Sold by
Meikle Kathleen H
Bought by
Kilpack Lloyd A and Kilpack Mellanee M
Create a Home Valuation Report for This Property
The Home Valuation Report is an in-depth analysis detailing your home's value as well as a comparison with similar homes in the area
Purchase History
| Date | Buyer | Sale Price | Title Company |
|---|---|---|---|
| Kilpack Joshua A | -- | Eagle Pointe Title Ins Agenc | |
| Kilpack Lloyd A | -- | -- |
Source: Public Records
Mortgage History
| Date | Status | Borrower | Loan Amount |
|---|---|---|---|
| Open | Kilpack Joshua A | $154,200 |
Source: Public Records
Tax History
| Year | Tax Paid | Tax Assessment Tax Assessment Total Assessment is a certain percentage of the fair market value that is determined by local assessors to be the total taxable value of land and additions on the property. | Land | Improvement |
|---|---|---|---|---|
| 2025 | $2,904 | $261,250 | $136,186 | $125,064 |
| 2024 | $2,708 | $253,000 | $122,861 | $130,139 |
| 2023 | $2,590 | $439,000 | $224,976 | $214,024 |
| 2022 | $2,726 | $254,100 | $122,564 | $131,536 |
| 2021 | $2,377 | $338,000 | $160,449 | $177,551 |
| 2020 | $2,107 | $300,000 | $136,556 | $163,444 |
| 2019 | $2,127 | $296,000 | $140,843 | $155,157 |
| 2018 | $1,969 | $269,000 | $137,984 | $131,016 |
| 2016 | $1,703 | $126,005 | $53,222 | $72,783 |
| 2015 | $1,662 | $115,995 | $53,222 | $62,773 |
| 2014 | $1,642 | $118,078 | $53,222 | $64,856 |
| 2013 | -- | $85,340 | $55,015 | $30,325 |
Source: Public Records
Map
Nearby Homes
- 861 E Millbrook Way
- 795 Abby Ln Unit 5
- 323 Peach Ln
- 520 S Orchard Dr Unit 17
- 337 Peach Ln
- 275 E Peach Ln S
- 380 E 1500 S
- 631 E 1700 S
- 545 S 100 E
- 771 E 1825 S
- 288 E 1650 S
- 438 E 1800 S
- 141 E 1650 S
- 650 S Main St Unit 9106
- 1886 S Jeri Dr
- 1654 S 100 E
- 34 W 400 S
- 32 W 400 S
- 1087 Arlington Way
- 109 W 900 S
Your Personal Tour Guide
Ask me questions while you tour the home.