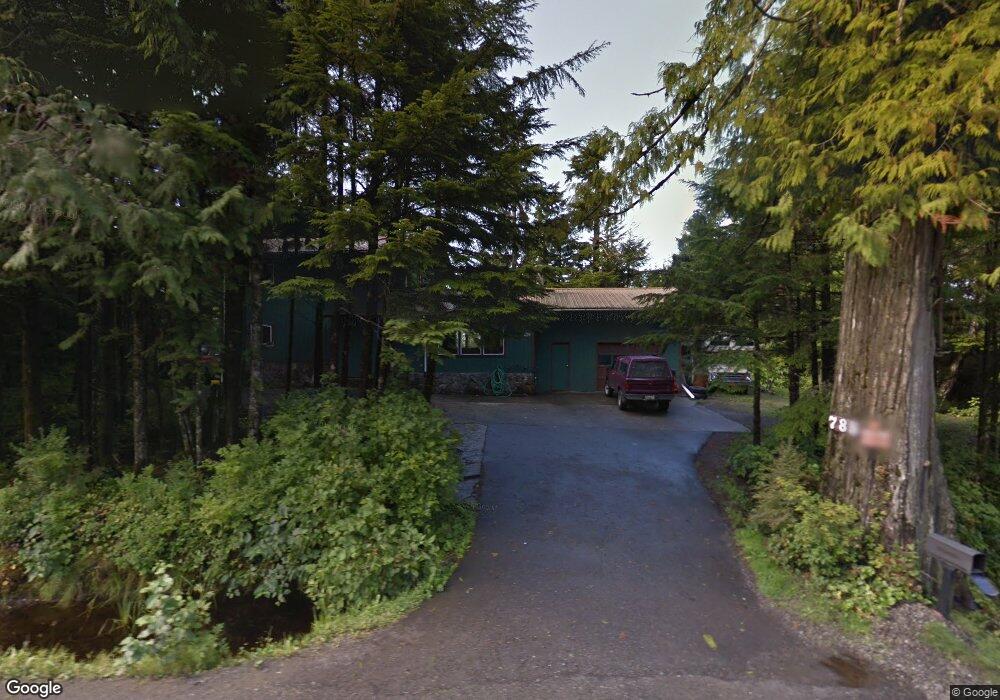
785 S Point Higgins Rd Ketchikan, AK 99901
Estimated Value: $362,000 - $723,000
4
Beds
2
Baths
2,528
Sq Ft
$200/Sq Ft
Est. Value
About This Home
This home is located at 785 S Point Higgins Rd, Ketchikan, AK 99901 and is currently estimated at $504,997, approximately $199 per square foot. 785 S Point Higgins Rd is a home located in Ketchikan Gateway Borough with nearby schools including Ketchikan High School and Clover Pass Christian School.
Ownership History
Date
Name
Owned For
Owner Type
Purchase Details
Closed on
Aug 9, 2022
Sold by
Sammon Philip L
Bought by
Coates Kevin
Current Estimated Value
Home Financials for this Owner
Home Financials are based on the most recent Mortgage that was taken out on this home.
Original Mortgage
$218,000
Outstanding Balance
$90,753
Interest Rate
5.54%
Mortgage Type
Balloon
Estimated Equity
$414,244
Purchase Details
Closed on
Dec 22, 2015
Sold by
Sammon Philip L and Sammon Phillip L
Bought by
Sammon Philip L
Home Financials for this Owner
Home Financials are based on the most recent Mortgage that was taken out on this home.
Original Mortgage
$241,643
Interest Rate
3.96%
Mortgage Type
VA
Purchase Details
Closed on
Aug 7, 2007
Sold by
Miller Thomas A and Miller Glenda J
Bought by
Sammon Phillip L
Home Financials for this Owner
Home Financials are based on the most recent Mortgage that was taken out on this home.
Original Mortgage
$266,000
Interest Rate
6.65%
Mortgage Type
VA
Create a Home Valuation Report for This Property
The Home Valuation Report is an in-depth analysis detailing your home's value as well as a comparison with similar homes in the area
Home Values in the Area
Average Home Value in this Area
Purchase History
| Date | Buyer | Sale Price | Title Company |
|---|---|---|---|
| Coates Kevin | -- | None Listed On Document | |
| Sammon Philip L | -- | Nations Lending Services | |
| Sammon Phillip L | -- | None Available |
Source: Public Records
Mortgage History
| Date | Status | Borrower | Loan Amount |
|---|---|---|---|
| Open | Coates Kevin | $218,000 | |
| Previous Owner | Sammon Philip L | $241,643 | |
| Previous Owner | Sammon Phillip L | $266,000 |
Source: Public Records
Tax History Compared to Growth
Tax History
| Year | Tax Paid | Tax Assessment Tax Assessment Total Assessment is a certain percentage of the fair market value that is determined by local assessors to be the total taxable value of land and additions on the property. | Land | Improvement |
|---|---|---|---|---|
| 2025 | $2,473 | $350,800 | $79,300 | $271,500 |
| 2024 | $2,414 | $337,600 | $76,300 | $261,300 |
| 2023 | $2,367 | $311,500 | $67,600 | $243,900 |
| 2022 | $2,677 | $352,200 | $67,600 | $284,600 |
| 2021 | $2,579 | $339,400 | $67,600 | $271,800 |
| 2020 | $2,481 | $335,300 | $66,100 | $269,200 |
| 2019 | $2,444 | $330,300 | $66,100 | $264,200 |
| 2018 | $2,035 | $275,000 | $66,100 | $208,900 |
| 2017 | $1,948 | $263,300 | $0 | $0 |
| 2016 | $1,862 | $251,600 | $0 | $0 |
| 2015 | -- | $246,100 | $0 | $0 |
| 2014 | -- | $243,800 | $0 | $0 |
Source: Public Records
Map
Nearby Homes
- 90 Earl Hines Ln
- 19 Juneberry Rd
- 12399 Blackberry Ln
- 215 Loganberry Ct
- 12101 Elderberry Ln
- 1402 Pond Reef Rd
- 0000 Pond Reef Rd
- 11385 N Tongass Hwy
- 11385 N Tongass Hwy Unit SP507
- 000 Stonebrook Way Unit Lot 3
- 11245 Shull Rd N
- 315 Huddle Rd
- 607 Rigging Ln
- Lot 2 Beacon Hill Ln
- 413 N Higgins Ct
- 66 Garland Ct
- 10939 Klawock Ln
- 243 W Mattle Rd
- 426 Knudson Cove Rd
- 10709 Gena Rd
- 839 S Point Higgins Rd
- 788/790 S Pt Higgins Rd
- 59 Earl Hines Ln
- 739 S Point Higgins Rd
- 735 S Point Higgins Rd
- 764 S Point Higgins Rd Unit B
- 740/742 S Pt Higgins Rd
- 105 Earl Hines Ln
- 56 Earl Hines Ln
- 716/716A S Pt Higgins Rd
- 215 Strawberry Rd
- 197 Strawberry Rd
- 193 Bunchberry Ln
- 70 Earl Hines Ln
- 702 S Point Higgins Rd
- 102 Earl Hines Ln
- 175 Strawberry Rd
- 651 Deerberry Ct
- 153 Strawberry Rd
- 131 Strawberry Rd